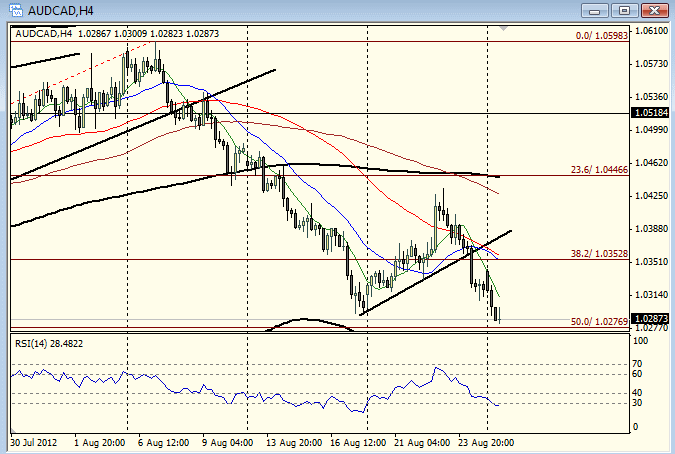
AUD/CAD 4H Chart 8/27/2012 8:55AM EDT

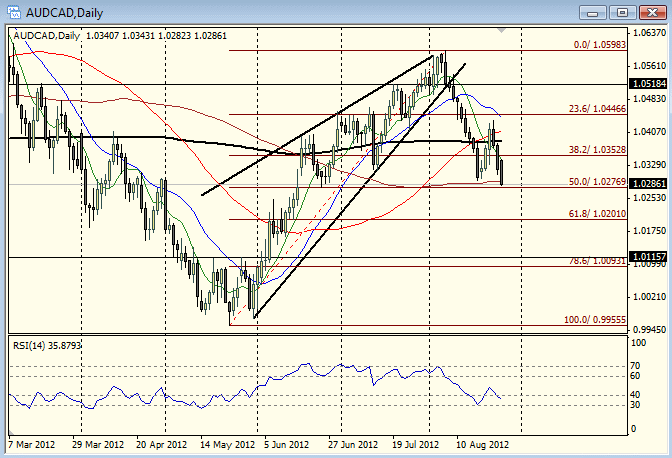
The AUD/CAD has been falling through the month of August, since finding resistance just under the 1.06 handle. After a short-term correction from 1.0290 to 1.0435. As we start another week, the AUD/CAD has pushed to a new August low about to test 50% retracement of the 0.9955 to 1.0598 swing from late May through July. (See in daily chart.)
In the daily chart, you can also see that the 50% retracement, 1.0277 level is also a previous support pivot. Below this minor pivot and Fibonacci confluence, is the 61.8% retracement at the 1.02 psychological handle. This should be the short-term target for now in this bearish continuation attempt. The next will be 1.01-1.0115 area, then the parity level.
The 4H chart, where the moving averages are coming into bearish alignment (with the 200SMA on top, and then 100, 55, 21, and at the bottom, closest to price, 8SMA). However, the daily chart shows that the market is really ranging in the longer medium-term as the moving averages whip back and forth each other and price. This suggests that would be not be too aggressive on the bearish outlook.
In this “range-bound” scenario, it is best to imagine that the further price is from the 200-day SMA, the more tension it has to regress back towards it, because the 200-SMA can be considered mean price action for the medium to long-term range. (Since May 2011.)
AUD/CAD Daily Chart 8/27/2012 9:00AM EDT
 AUD/CAD" title="AUD/CAD" width="736" height="464">
Disclaimer: Information and opinions contained in this report are for educational purposes only and do not constitute an investment advice. While the information contained herein was obtained from sources believed to be reliable, author does not guarantee its accuracy or completeness. FXTimes will not accept liability for any loss of profit or damage which may arise directly, indirectly or consequently from use of or reliance on the trading set-ups or any accompanying chart analysis.
Original post

The AUD/CAD has been falling through the month of August, since finding resistance just under the 1.06 handle. After a short-term correction from 1.0290 to 1.0435. As we start another week, the AUD/CAD has pushed to a new August low about to test 50% retracement of the 0.9955 to 1.0598 swing from late May through July. (See in daily chart.)
In the daily chart, you can also see that the 50% retracement, 1.0277 level is also a previous support pivot. Below this minor pivot and Fibonacci confluence, is the 61.8% retracement at the 1.02 psychological handle. This should be the short-term target for now in this bearish continuation attempt. The next will be 1.01-1.0115 area, then the parity level.
The 4H chart, where the moving averages are coming into bearish alignment (with the 200SMA on top, and then 100, 55, 21, and at the bottom, closest to price, 8SMA). However, the daily chart shows that the market is really ranging in the longer medium-term as the moving averages whip back and forth each other and price. This suggests that would be not be too aggressive on the bearish outlook.
In this “range-bound” scenario, it is best to imagine that the further price is from the 200-day SMA, the more tension it has to regress back towards it, because the 200-SMA can be considered mean price action for the medium to long-term range. (Since May 2011.)
AUD/CAD Daily Chart 8/27/2012 9:00AM EDT
 AUD/CAD" title="AUD/CAD" width="736" height="464">
Disclaimer: Information and opinions contained in this report are for educational purposes only and do not constitute an investment advice. While the information contained herein was obtained from sources believed to be reliable, author does not guarantee its accuracy or completeness. FXTimes will not accept liability for any loss of profit or damage which may arise directly, indirectly or consequently from use of or reliance on the trading set-ups or any accompanying chart analysis.
Original post
