
AUD/CAD continues to rise after the recent completion of the Clear Triangle chart pattern identified on the 30-minute charts. The overall Quality of this Triangle is rated at the 5 bar level as a result of the low Initial Trend and Uniformity (rated at the 4 and 3 bar levels respectively) and high Clarity (8 bars). The completion of this chart pattern follows the predominant uptrend visible on the daily and the weekly AUD/CAD charts.
More specifically, this Triangle follows the previous daily upward price impulse which started in May of this year – when the pair reversed up from the strong support area lying at the confluence of the following support price levels: the weekly uptrend support trendline from the February of 2009, the 38.2% Fibonacci Retracement of the preceding sharp upward price thrust from the July of 2010 as well as the strong support at the round price level 0.9900. The pair is expected to rise further toward the Forecast Price 1.0433.

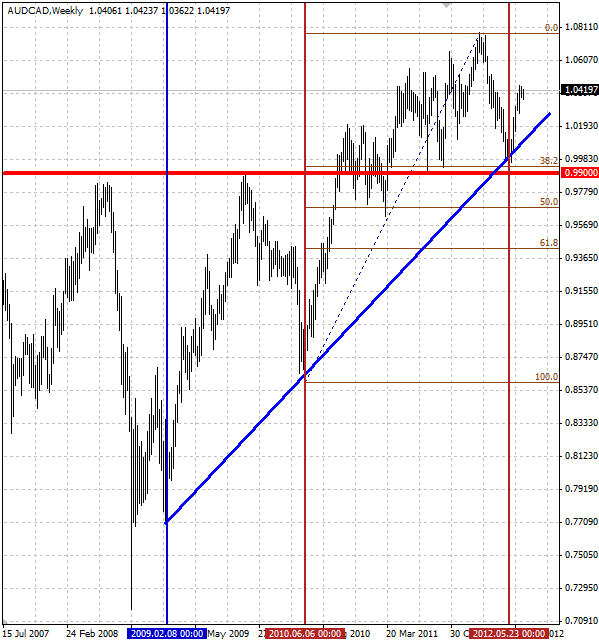
The following weekly AUD/CAD chart highlights the technical price levels mentioned above:
 AUD/USD Weekly" title="AUD/USD Weekly" width="599" height="642" />
More specifically, this Triangle follows the previous daily upward price impulse which started in May of this year – when the pair reversed up from the strong support area lying at the confluence of the following support price levels: the weekly uptrend support trendline from the February of 2009, the 38.2% Fibonacci Retracement of the preceding sharp upward price thrust from the July of 2010 as well as the strong support at the round price level 0.9900. The pair is expected to rise further toward the Forecast Price 1.0433.
The following weekly AUD/CAD chart highlights the technical price levels mentioned above:
AUD/USD Weekly" title="AUD/USD Weekly" width="599" height="642" />