
AUD/CAD continues to rise after the recent breakout of the well-formed Triangle chart pattern identified by Autochartist on the daily charts. Autochartist rates the overall Quality of this chart pattern at the 5 bar level as a result of the slow Initial Trend (2 bars) and near maximum Uniformity and Clarity (both rated at the 9 bar level).
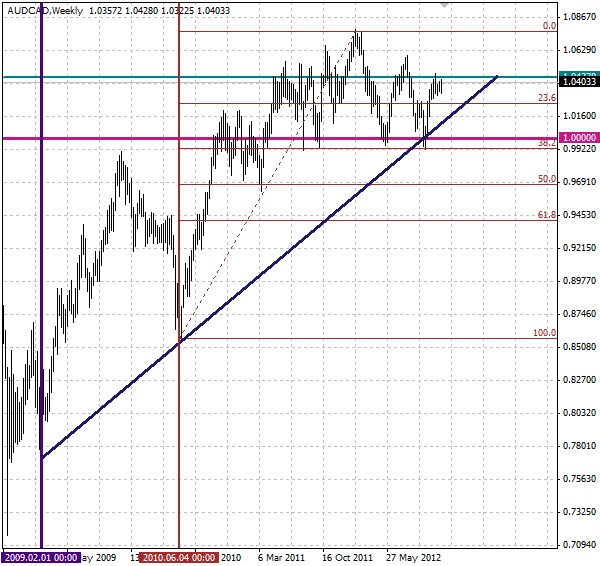
The completion of this Triangle continues the strong upward trend visible on the daily and the weekly AUD/CAD charts. More specifically this Triangle breakout follows the preceding sharp upward price impulse from the strong support area made out of the following support levels: the parity, 38,2% Fibonacci retracement of the preceding weekly upward price thrust from June of 2010 as well as the longer-term support trendline from the start of 2009. The pair is expected to rise further toward the Forecast Price 1.0437.

The following weekly AUD/CAD chart shows the aforementioned support levels:
 AUD/CAD" title="AUD/CAD" width="600" height="566" />
The completion of this Triangle continues the strong upward trend visible on the daily and the weekly AUD/CAD charts. More specifically this Triangle breakout follows the preceding sharp upward price impulse from the strong support area made out of the following support levels: the parity, 38,2% Fibonacci retracement of the preceding weekly upward price thrust from June of 2010 as well as the longer-term support trendline from the start of 2009. The pair is expected to rise further toward the Forecast Price 1.0437.
The following weekly AUD/CAD chart shows the aforementioned support levels:
AUD/CAD" title="AUD/CAD" width="600" height="566" />