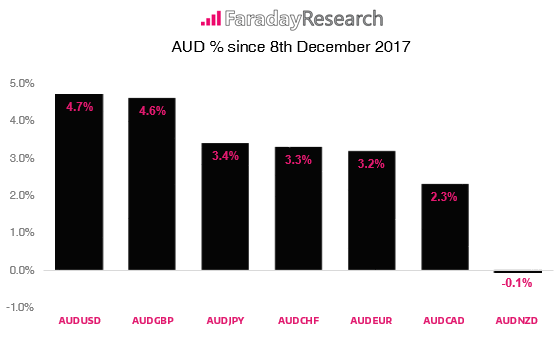
The Australian Dollar was given another boost today after retail sales far exceeded expectations. Poking its’ nose to a 3-month high before edging low, the move follows on from an impressive run since the 8th December low. Since then, AUD/USD has already gained 4.7% and, with exception to NZD, dominated the majors. So as AUD/USD is the stronger pair on a relative strength basis (with AUD/GBP hot on its heels) we’re keen to explore bullish opportunities if conditions allow.
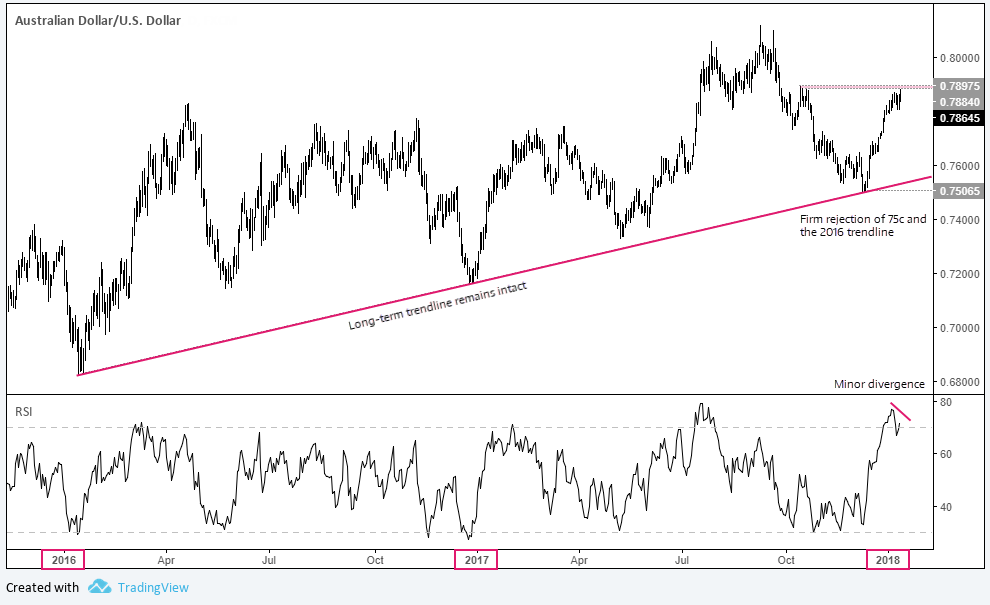
In a video from late December we highlighted that AUD/USD had provided strong rallies at the beginning 2016 and 2017. At the time of the video we’d already seen a firm rejection of 75c which respected the 2016 trendline, and the gains which followed strongly suggests this seasonal pattern has arrived a few weeks early.
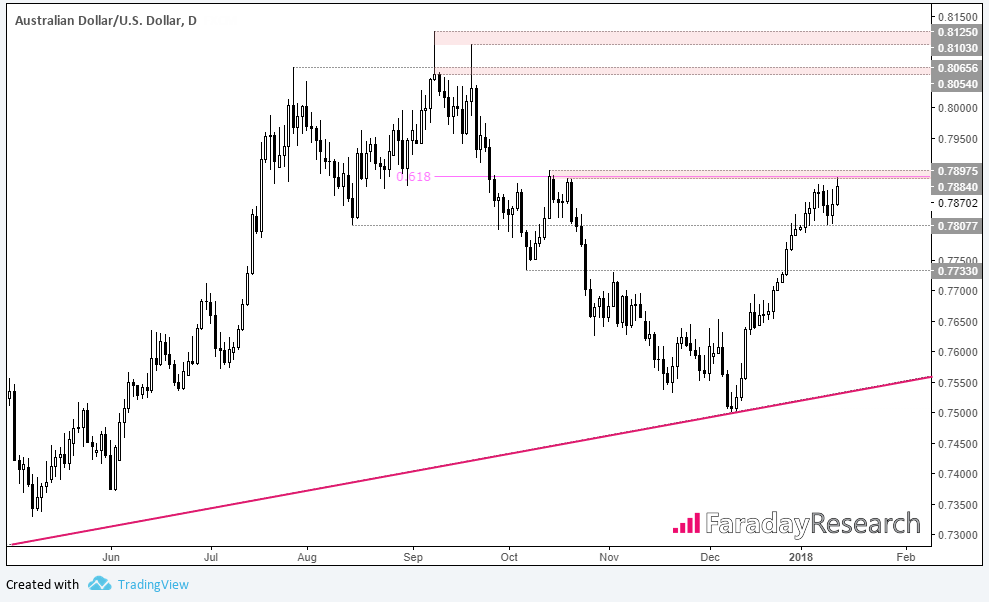
Indeed, the move from the 0.7506 low has exhibited strong bullish momentum and retracement have been minor (borderline non-existent). The 2016 trendline remains intact and the magnitude of the rally can be seen on the longer-term daily chart below. Yet whilst we are keen to capitalise on this bullish momentum, a couple of obstacles could stand in its way.

US inflation data will be the core focus tomorrow as traders try to decipher whether the Fed are on track to raise in March. As this leaves little time to adequately manage USD positions on the daily timeframe ahead of it, majors are unfortunately off-of the menu. But from AUD’s perspective a strong data set could keep AUD below 79c or force it lower.
A cluster of resistance below 79c has (so far) paused the rally. AUD/USD bumped its head off-of the zone’s lower boundary which comprises of the October highs and a 61.8% retracement level. Furthermore, RSI is also overbought and the early stages of a bearish divergence are forming. So it’s possible the rally may peter out and decide if it wants to take a breather, retrace or completely reverse. But if price is to break resistance, we’d assume the bullish trend is to continue.
Zooming in to the daily chart we can see AUD/USD is effectively ranging between 0.787-0.7884. A decisive break above resistance (call it 0.79) paves the way for a potential run towards the psychological round number of 80. A break of this level places a selection of 2017-highs in site. The key ingredient we’d need to enter is a low volatility entry which should boost the potential reward to risk ratio.

Yet before we get ahead of ourselves, if tomorrow’s CPI data were to surprise to the upside (or today’s PPI for that matter) we’d expect 0.7900 to cap as resistance unless we see another bout of broad, Greenback weakness. Assuming support around 0.7807 holds it could allow AUD/USD to form a congestion box or provide further signs of compression on the daily timeframe. This is by no means a bad scenario as we could consider trading the actual break above 0.7900 if conditions allow.
And whilst we would prefer to see an eventual break higher, if 0.7807 support were to buckle under pressure it still doesn’t change the trend. It would however put AUD/USD onto the backburner until a more suitable opportunity arises.
AUD bumps it head on resistance cluster - yet 80c is tantalisingly close.
