AUD Bulls Contained By Risk-Off And AU GDP

Published 12/04/2019, 01:26 AM
EUR/USD
-
GBP/USD
-
AUD/USD
-
EUR/AUD
-
AUD/JPY
-
AXJO
-
USD/CNH
-
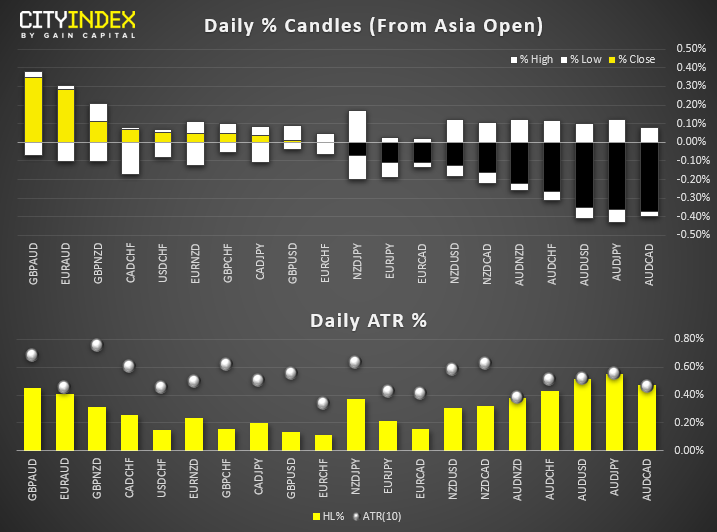
Daily % Candles (From Asia Open)

FX Brief:

  • Australia’s GDP missed expectations at 0.4% QoQ vs 0.5% expected. It didn’t take long for Twitter to mock RBA’s ‘gentle turning point’ in the economy. Earlier, service PMI expanded but at a slower pace of 53.7 vs 54.2 prior. Ultimately, it still appears likely RBA will cut in Q1 and possibly as early in February (1st meeting of the year).
  • US House voted to impose Chinese sanctions over human rights abuses over the Uighur Muslim Minority. Another factor to consider for how ‘well’ phase one trade talks are going.
  • British pound remains supported after yesterday’s polls show conservatives widening their lead.
  • China’s service PMI expanded at its fastest pace in 7 months at 53.5, up from 51.1 prior. Hong Kong’s PMI slumps to 38.5.
  • Price Action:

  • CHF and JPY were the strongest currencies as trade war worries deepened. No daily ranges are yet to exceed their daily ATR’s, although AUD/JPY, AUD/USD and EUR/AUD came the closest after AUD fell following weaker than expected GDP figures.
  • With DXY balancing precariously on 97.68 support, traders are now waiting for to see if a corrective rebound or bearish breakdown will now follow.
  • EUR/USD has paused at 1.1093 resistance as expected, printing a rikshaw man doji (indecision candle) below resistance.
  • GBP/USD closed just shy of 1.3000 overnight and is teasing traders with a bullish breakout of this key level. An inverted head and shoulders pattern could be in the making (a continuation pattern during an uptrend) which projects and approximate target around 1.3250 is successful.
  • NZD/USD’s rally stalled perfectly near its upper channel yesterday, leaving the door open to a period of consolidation (further out we anticipate new highs for NZD crosses).
  • USD/CNH remains just off its 30-day high. It’s essentially a barometer of how well trade talks are going. Given they’re not going well, the yuan is weaker – which is something else which will likely irk President Trump.
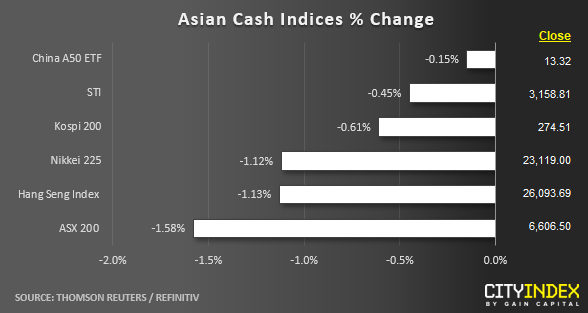
  • Asian Cash Indices % Change

    Equity Brief:

  • Risk-off continues to rage in key Asian stock markets where trade worries have resurfaced again after U.S. President Trump has resumed his “Tariff Man” alter ego. Trump has commented that he has no urgency for a trade deal with China that has dashed the hopes of the much hyped “final throes” Phase One deal signed off before the 15 Dec deadline kicks in for another round of U.S. tariffs on Chinese products.
  • Media has reported that according to sources from U.S. trade department that the U.S. administration is set to impose 15% tariffs on US$160 billion worth of Chinese products on 15 Dec if U.S and China cannot agree to a Phase One trade deal.
  • On the geopolitical front, more tension is on the rise between U.S. and China that can derail the prospect of a trade deal. The U.S. House has passed the Xinjiang Bill that sought to enact sanctions on China over human rights abuses and prohibit the export of certain U.S. technologies products that can be used in state-sponsored suppression.
  • Australia’s ASX 200 is the worst performer for the 2nd consecutive session with a loss of -1.58%. The current losses in the past 3 days have now wiped out the entire monthly gain for Nov. Energy and Industrial stocks led the bears where both sectors have tumbled by around 2% so far.
  • Losses in China stock market has been muted with the China A50 that has only shed -0.15% supported by a resilient China’s service industry despite the on-going trade tensions. The Caixin/Market Services PMI for Nov rose to 53.5 from 51.10 in Oct, a 7-moth high and the fastest pact of expansion since Apr 2019. It also surpassed the consensus forecast that is set at 52.7.
  • Price Acton (derived from CFD indices):

  • Japan 225: Minor downtrend from 02 Dec 2019 swing high remains intact with further potential downside to test the key medium-term support at 22700 (former swing high areas of 08 Nov/03 Dec 2018 & 21 Nov 2019 swing low). Key short-term resistance stands at 23200 (minor descending trendline from 02 Dec 2019 high & former 03 Dec 2019 swing low).
  • Hong Kong 50: Broke below the lower boundary of the ascending range configuration in place since 15 Aug 2019 low now turns pull-back resistance at 26300 with risk of further downside to test the next near-term support at 25660/500 (28 Sep/10 Oct 2019 swing low areas).
  • Australia 200: Tumbled and hit the 6630 range support in place since 21 Oct 2019 with extreme oversold readings seen in short-term momentum oscillators which suggests an overextended decline. Watch the 6655 minor resistance (former 21 Nov 2019 minor swing low) & a break above 6655 sees a minor mean reversion rebound towards 6740/6780 (50%/61.8% retracement of the on-going decline from 29 Nov 2019 high).
  • US SP 500: Broke below the 3110 (the gapped up from 22/25 Nov 2019 & the lower boundary of the ascending channel from 03 Oct 2019 low). Now at risk of further downside towards the next near-term support at 3045 (lower boundary of minor descending channel from 02 Dec 2019 high & 0.618 Fibonacci expansion of the current down move from 02 Dec high to 03 Dec low projected from today’s Asian session high of 3096). Key short-term resistance stands at 3113.
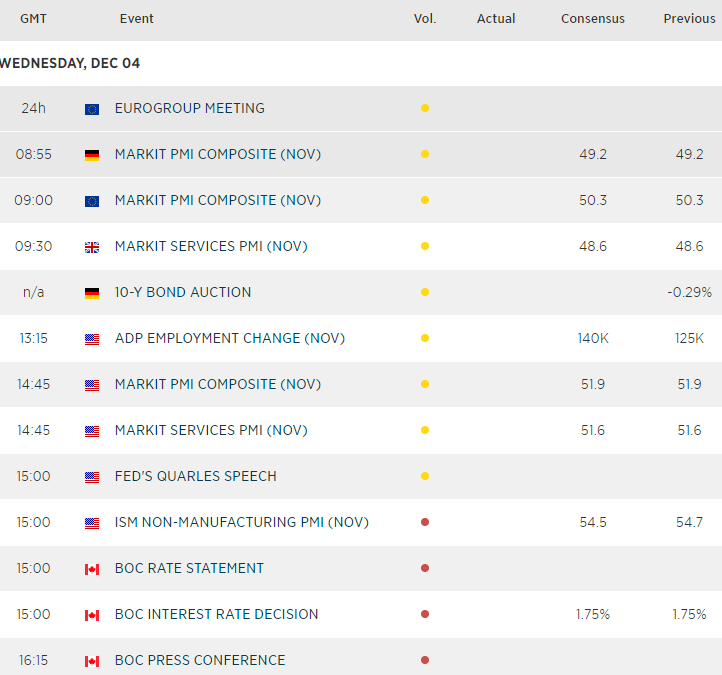
  • Economic Calendar

    Original Post

    Latest comments

    Loading next article…
    Risk Disclosure: Trading in financial instruments and/or cryptocurrencies involves high risks including the risk of losing some, or all, of your investment amount, and may not be suitable for all investors. Prices of cryptocurrencies are extremely volatile and may be affected by external factors such as financial, regulatory or political events. Trading on margin increases the financial risks.
    Before deciding to trade in financial instrument or cryptocurrencies you should be fully informed of the risks and costs associated with trading the financial markets, carefully consider your investment objectives, level of experience, and risk appetite, and seek professional advice where needed.
    Fusion Media would like to remind you that the data contained in this website is not necessarily real-time nor accurate. The data and prices on the website are not necessarily provided by any market or exchange, but may be provided by market makers, and so prices may not be accurate and may differ from the actual price at any given market, meaning prices are indicative and not appropriate for trading purposes. Fusion Media and any provider of the data contained in this website will not accept liability for any loss or damage as a result of your trading, or your reliance on the information contained within this website.
    It is prohibited to use, store, reproduce, display, modify, transmit or distribute the data contained in this website without the explicit prior written permission of Fusion Media and/or the data provider. All intellectual property rights are reserved by the providers and/or the exchange providing the data contained in this website.
    Fusion Media may be compensated by the advertisers that appear on the website, based on your interaction with the advertisements or advertisers.
    © 2007-2025 - Fusion Media Limited. All Rights Reserved.