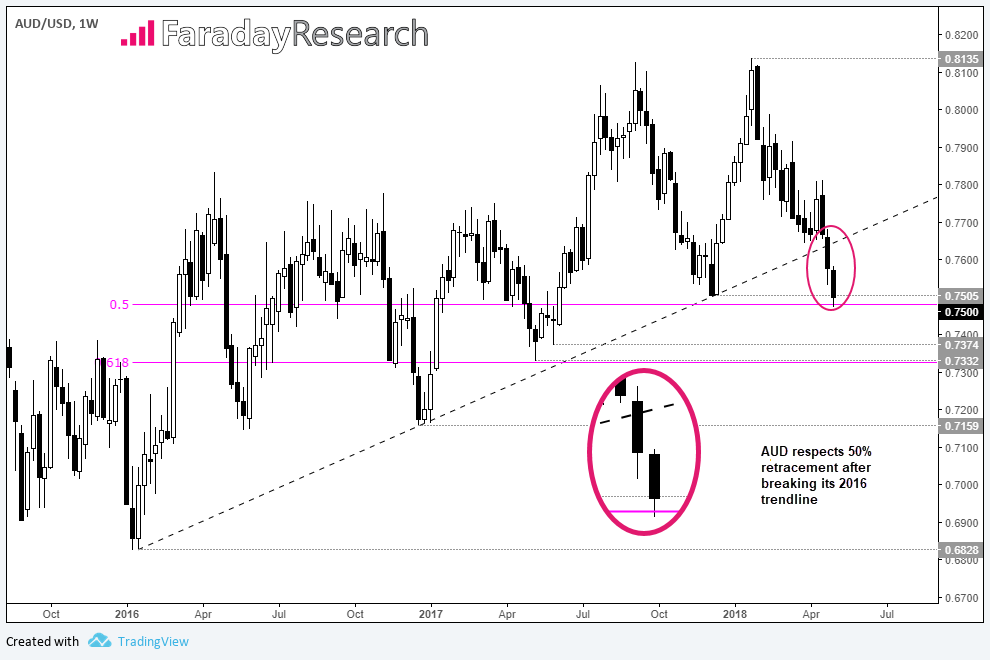
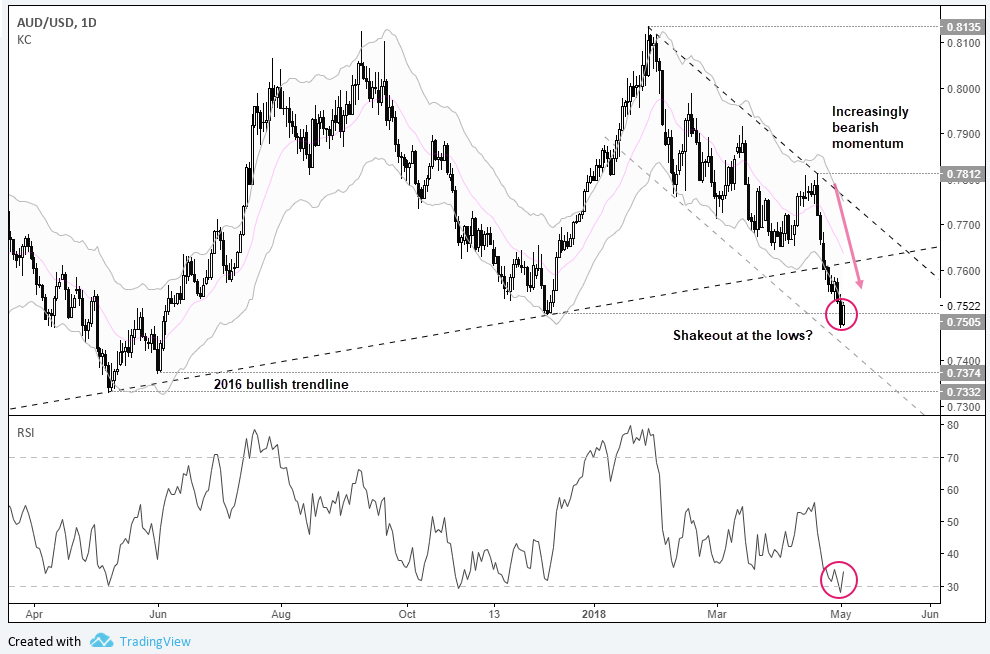
Since around mid-April the US dollar has moved broadly higher against its peers. One by one we’re seeing majors break or approach key levels, with AUD having now broken December’s low after invalidating it 2016 trendline last week.

We can see on AUD’s weekly chart that the decline has stalled at the 50% Fibonacci retracement level between the 2016 low and 2018 high. The break of trendline and clear bearish range expansion favours an eventual run towards the 0.7374 or 0.7332 lows, but the 50% could mark a pause in trend at least.

AUD’s daily chart shows that bearish momentum has increased since the 0.7812 high and only minor retracements have materialised. Furthermore, the 2016 bullish trendline made little effort to halt the decline, allowing AUD to crash decisively through it and shed a further 1.7% since the trendline break. So, whilst we’ve seen a minor bounce above the 50% retracement, we favour a break beneath it sooner than later.
Still, to enter on the daily timeframe we’d prefer to see compression or a retracement before committing to a short. RSI is oversold and price is extended beyond the lower Keltner band to warn of over-extension over the near-term. Moreover, whilst we saw a firm close beneath December’s low yesterday, AUD has since broken back above 75c to warn of a false break. We’ll await to see if this breakout turns into a fakeout, and step aside until at least a minor bounce has been seen and the FOMC minutes and NFP report are out of the way.
