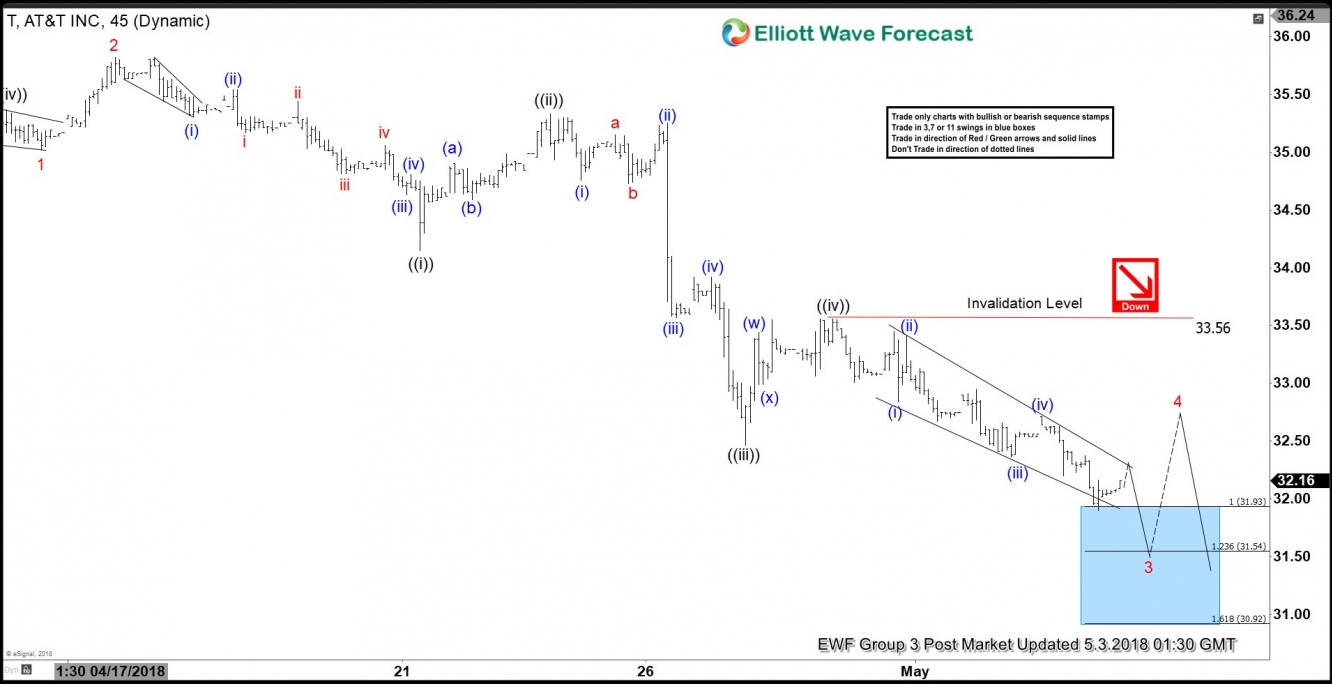
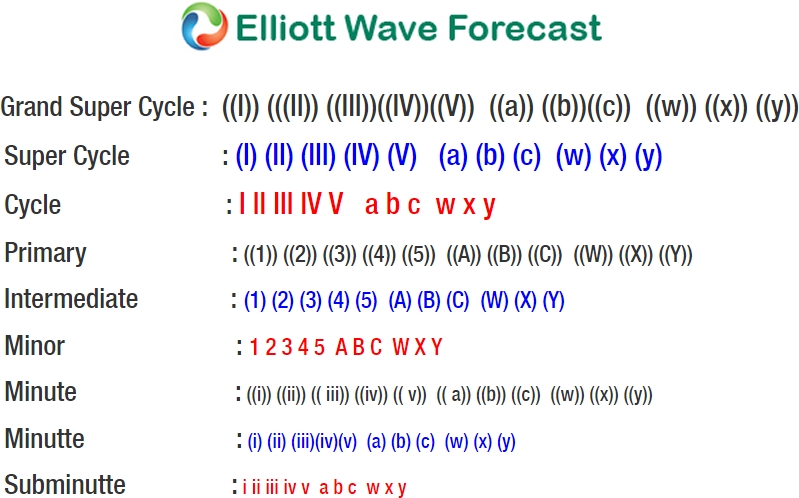
AT&T (NYSE:T) ticker symbol $T short-term Elliott Wave view suggests that the decline from 4/10 peak is unfolding as an Impulse Elliott Wave structure. In the impulsive structure, wave 1, 3, and 5 should show 5 waves internal subdivision.
Down from 4/10 peak ($36.39), Minor wave 1 ended in 5 waves structure at 35.02 low. Minor wave 2 bounce ended at 35.82 and Minor wave 3 is in progress with subdivision of 5 waves impulsive structure in the lesser degree. Down from 35.82, Minute wave ((i)) of 3 ended at 34.15, Minute wave ((ii)) of 3 ended at 35.33, Minute wave ((iii)) of 3 ended at 32.47, and Minute wave ((iv)) of 3 ended at 33.56 high.
Below from there, Minute wave ((v)) of 3 remains in progress. Minor wave 3 has reached the minimum number of swings and target, although a marginal low still can’t be ruled out towards $31.54 – $30.92. This is the 123.6%-161.8% Fibonacci extension area of ((v))=((i)). Afterwards, AT&T should end the 5 waves structure in Minor wave 3 and see a Minor wave 4 bounce in 3, 7 or 11 swings against 35.82 high before further downside resumes. We don’t like buying into the proposed bounce.
AT&T 1 Hour Elliott Wave Chart


