ATP Oil & Gas Corporation (ATP). is engaged in the acquisition, development and production of oil and natural gas properties in the Gulf of Mexico and the United Kingdom and Dutch sectors of the North Sea (the North Sea).
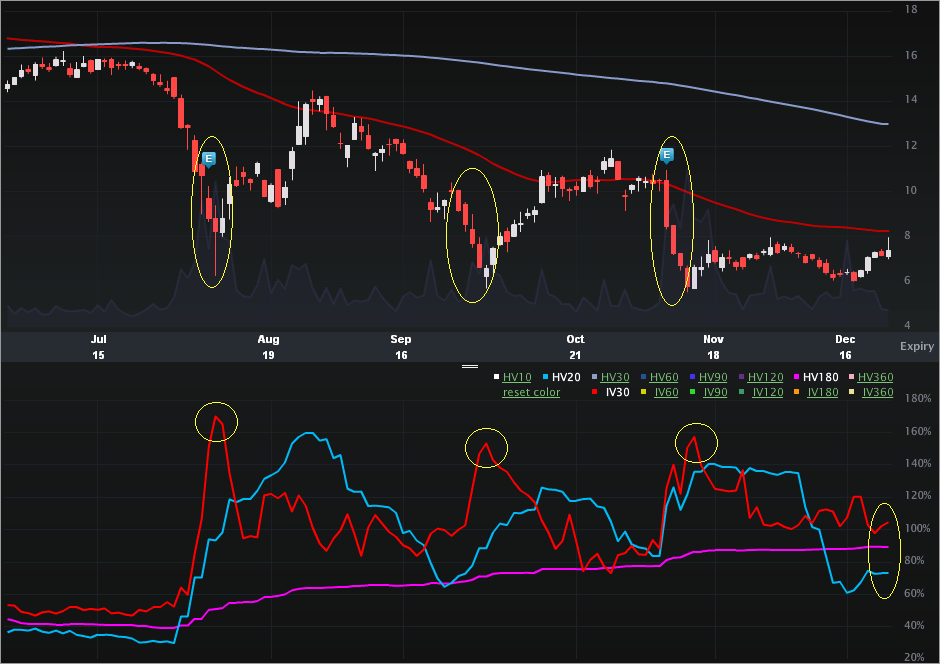
This is a vol note – specifically a company with elevated vol that tends to move in a patterned ebb and flow. Let’s start with the Charts Tab (6 months), below. The top portion is the stock price, the bottom is the vol (IV30™ - red vs HV20 - blue vs HV180 - pink).
I’ve circled/highlighted a lot here. In the stock portion (top) we can see three abrupt stock declines in the last six months. Two of those (the first and third) were directly off of an earnings release. On the vol side, we can see the implied spike into earnings. In the middle stock drop, we can see the implied spiked essentially as high as it did into earnings.
Let’s fast forward to today’s vol levels. We can see that while the implied is elevated to the two historical realized measures, it’s nowhere near those other three elevated levels.
Specifically:
IV30™: 104.61
HV20: 72.98
HV180: 89.42
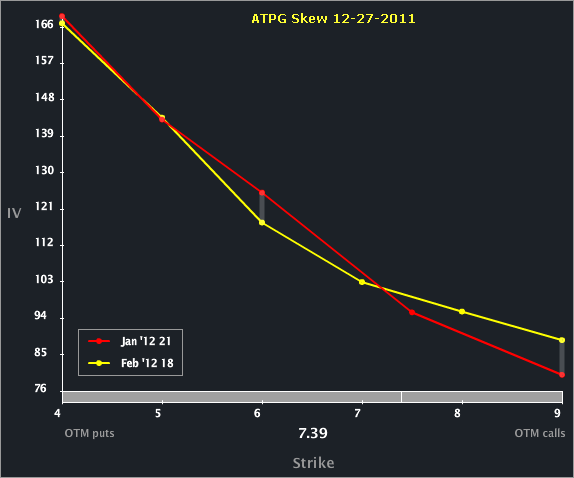
Let’s turn to the Skew Tab to examine the month-to-month and line-by-line vols.
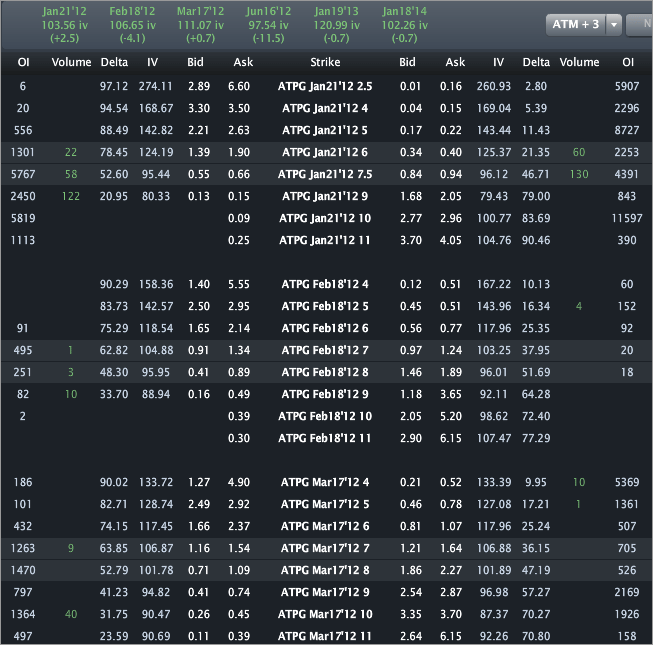
We can see that the Jan and Feb vols lie almost directly on top of each other so the elevated vol right now doesn’t seem to be focused on an event in one month and not in another. Ultimately the skew is “normal,” with the downside puts bid relative to the OTM calls.
Finally, let’s turn to the Skew Tab for completeness.
I wrote about this one for TheStreet.com (OptionsProfits), so no specific trade analysis here. I will say that the The 52 wk range in stock price for ATPG is [$5.53, $21.40]. While the next earnings release is likely after Feb expo, it’s the fact that the stock dropped and vol spiked a much as it did without an earnings report that caught my attention wrt to risk.
This is trade analysis, not a recommendation.
- English (UK)
- English (India)
- English (Canada)
- English (Australia)
- English (South Africa)
- English (Philippines)
- English (Nigeria)
- Deutsch
- Español (España)
- Español (México)
- Français
- Italiano
- Nederlands
- Português (Portugal)
- Polski
- Português (Brasil)
- Русский
- Türkçe
- العربية
- Ελληνικά
- Svenska
- Suomi
- עברית
- 日本語
- 한국어
- 简体中文
- 繁體中文
- Bahasa Indonesia
- Bahasa Melayu
- ไทย
- Tiếng Việt
- हिंदी
ATP Oil & Gas (ATPG) - Elevated Vol Trend
Published 12/28/2011, 02:45 AM
Updated 07/09/2023, 06:31 AM
ATP Oil & Gas (ATPG) - Elevated Vol Trend
Latest comments
Loading next article…
Install Our App
Risk Disclosure: Trading in financial instruments and/or cryptocurrencies involves high risks including the risk of losing some, or all, of your investment amount, and may not be suitable for all investors. Prices of cryptocurrencies are extremely volatile and may be affected by external factors such as financial, regulatory or political events. Trading on margin increases the financial risks.
Before deciding to trade in financial instrument or cryptocurrencies you should be fully informed of the risks and costs associated with trading the financial markets, carefully consider your investment objectives, level of experience, and risk appetite, and seek professional advice where needed.
Fusion Media would like to remind you that the data contained in this website is not necessarily real-time nor accurate. The data and prices on the website are not necessarily provided by any market or exchange, but may be provided by market makers, and so prices may not be accurate and may differ from the actual price at any given market, meaning prices are indicative and not appropriate for trading purposes. Fusion Media and any provider of the data contained in this website will not accept liability for any loss or damage as a result of your trading, or your reliance on the information contained within this website.
It is prohibited to use, store, reproduce, display, modify, transmit or distribute the data contained in this website without the explicit prior written permission of Fusion Media and/or the data provider. All intellectual property rights are reserved by the providers and/or the exchange providing the data contained in this website.
Fusion Media may be compensated by the advertisers that appear on the website, based on your interaction with the advertisements or advertisers.
© 2007-2025 - Fusion Media Limited. All Rights Reserved.
