
The Weekly Leading Index (WLI) of the Economic Cycle Research Institute (ECRI) rose in Friday's update. It is now at 129.3 versus the previous week's 128.4 (revised from 128.5). See the WLI chart in the Appendix below. The WLI annualized growth indicator (WLIg) also eased, now at 6.2, down from last week's 6.8. WLIg has declined for four consecutive weeks.
But the big news this week is the ECRI's Chief Operating Officer and spokesman, Lakshman Achuthan, returned to the media circuit with interviews yesterday on Bloomberg, CNBC and Yahoo's Daily Ticker. Click the links to view the videos.
In addition, ECRI has published a new commentary available to the general public:
Essentially Achuthan is sticking to his opinion that a recession began in mid-2012, although he now calls it a "mild" recession, which is quite a shift from his original stance 16 months ago: "...if you think this is a bad economy, you haven't seen anything yet."
ECRI posts its proprietary indicators on a one-week delayed basis to the general public, but last year the company switched its focus to a version of the Big Four Economic Indicators I've been tracking for the past several months. See, for example, this November 29th Bloomberg video that ECRI continues to feature on its website -- twelve weeks later -- along with the now clearly false assertion that "Indicators used to determine official U.S. recession dates have been falling since mid-year." Achuthan pinpoints July as the business cycle peak, thus putting us in the eighth month of a recession.
Here is a chart of ECRI's data that undermines the company's recession call -- the smoothed year-over-year percent change since 2000 of their proprietary weekly leading index. I've highlighted the 2011 date of ECRI's recession call and the hypothetical July business cycle peak, which the company claims was the start of a recession.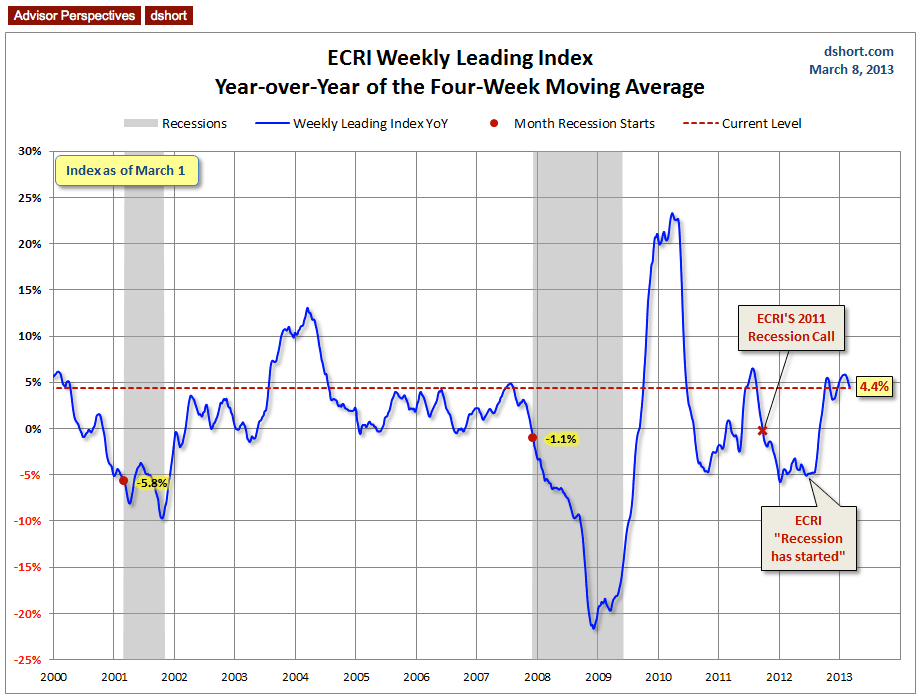
Now, apparently, ECRI is shifting its indicator focus once again. Their "Yo-Yo Years" report leads with chart of nominal GDP since 1981.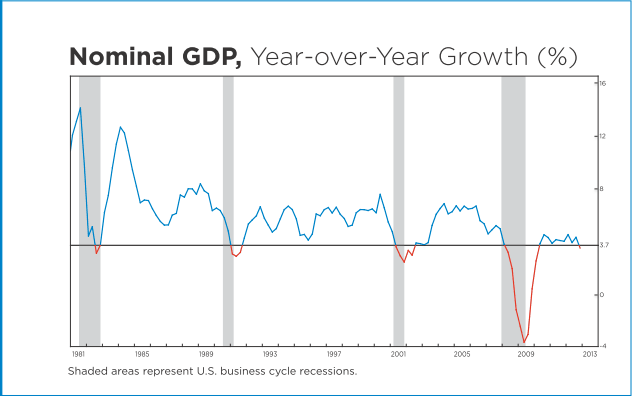
Discussion of the chart includes this assertion:
Below I've charted the complete series, and I've added a 2nd order polynomial regression to highlight a broad trend in this highly erratic data series. Growth in the US has been slowing for many years. The argument that 3.7% YoY growth in nominal GDP is a recession-maker at this point in our economic history is less convincing than it would have been prior to the 21st century.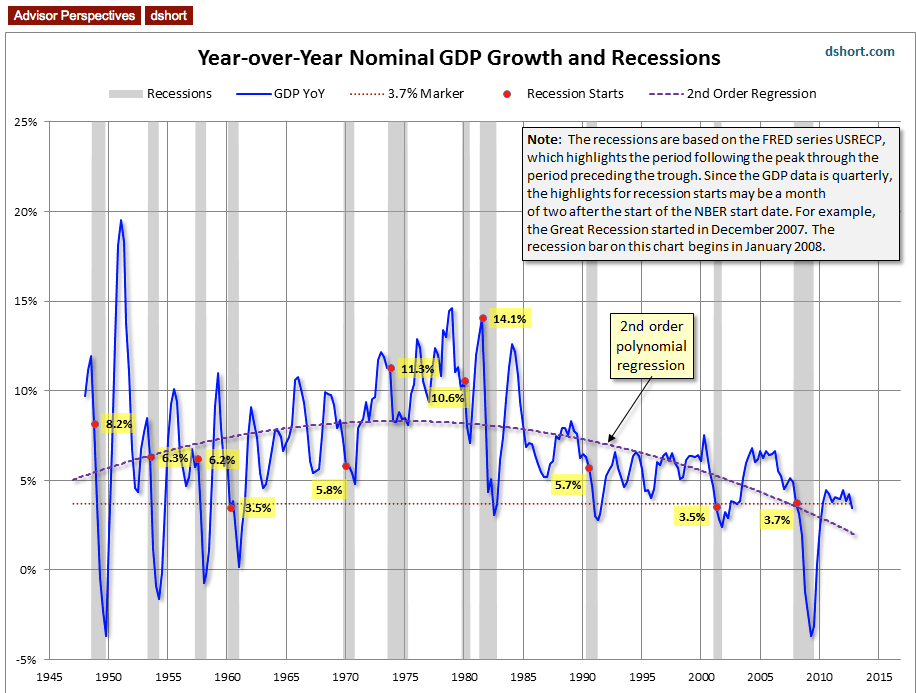
There is a rich array of data in the ECRI's "Yo-Yo Years" report. The discussion hops from nominal GDP to Real GDI (Gross Domestic Income) to year-over-year snapshots of the Big Four and more.
Ultimately my view is that the latest ECRI media blitz is best understood as an effort to salvage credibility in hopes that major revisions to the key economic indicators -- notably the July annual revisions to GDP -- will validate their position.
ECRI's Recession Call Was A Bet Against The Fed
Let's briefly review the history of the ECRI recession call. ECRI adamantly denied that the sharp decline of their indicators in 2010 marked the beginning of a recession. But in 2011, when their proprietary indicators were at levels higher than 2010, they made their controversial recession call with stunning confidence bordering on arrogance: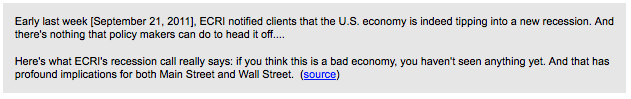
Ironically enough, on the same day ECRI forecast a recession, Chairman Bernanke announced a new policy, Operation Twist, which was followed by QE3 in September 2012 and unlimited easing (aka QE4) in December 2012.
Essentially ECRI claim that "there's nothing that policy makers can do to head it [a recession] off" was a bet against the Fed.
For a few months after ECRI's recession call, their proprietary indicators cooperated with their forecast, but that has not been the case since the second half of 2012 -- hence their switch to the traditional Big Four recession indicators. Now that those are less cooperative, ECRI is cherry picking other indicators and switching to year-over-year perspectives when the monthly trend isn't sloping downward.
My Personal View...
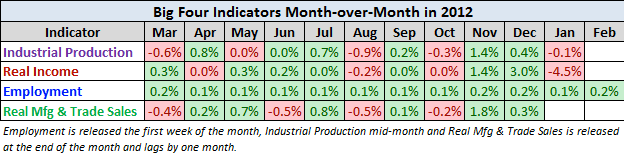
The Fiscal Cliff is behind us, but the 2% FICA increase may continue to weigh on spending before being absorbed into consumer behavior. The underlying trend in core personal income, if you exclude the tax-planning blip, is showing slight deterioration, and the January Industrial Production was weak. On the other hand, ECRI's preferred metric for sales, the lagging Real Manufacturing and Trade Sales data (updated last Friday, data through December), was strong in November and December. Here is a snapshot of ECRI's version of the Big Four Economic Indicators.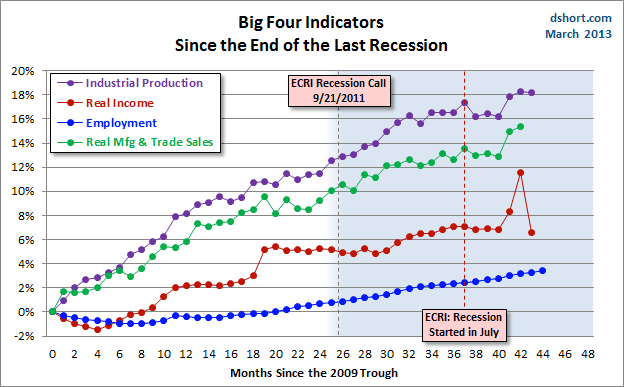
Despite my rejection of ECRI's call that a recession began in mid-2012, I do think the US economy remains at vulnerable. The greatest endogenous threat is the ongoing impact of the expired 2% FICA tax holiday, disappointing Personal Income and the real impact of sequestration, which has scarcely begun. Previously acknowledged exogenous risks are reemerging in eurozone recessions and the political stalemate in Italy may be copycatted elsewhere in the eurozone periphery.
The Second Estimate for Q4 GDP at 0.1 percent bears watching. Of course, the third Estimate could adjust it higher. But the hope that an improved trade balance would boost the Second Estimate didn't pan out.
The Usual Caveat: The recent economic data are subject to revision, so we must view these numbers accordingly.
Appendix: A Closer Look At The ECRI Index
Despite the apparent increasing irrelevance of the ECRI indicators, let's check them out. The first chart below shows the history of the Weekly Leading Index and highlights its current level.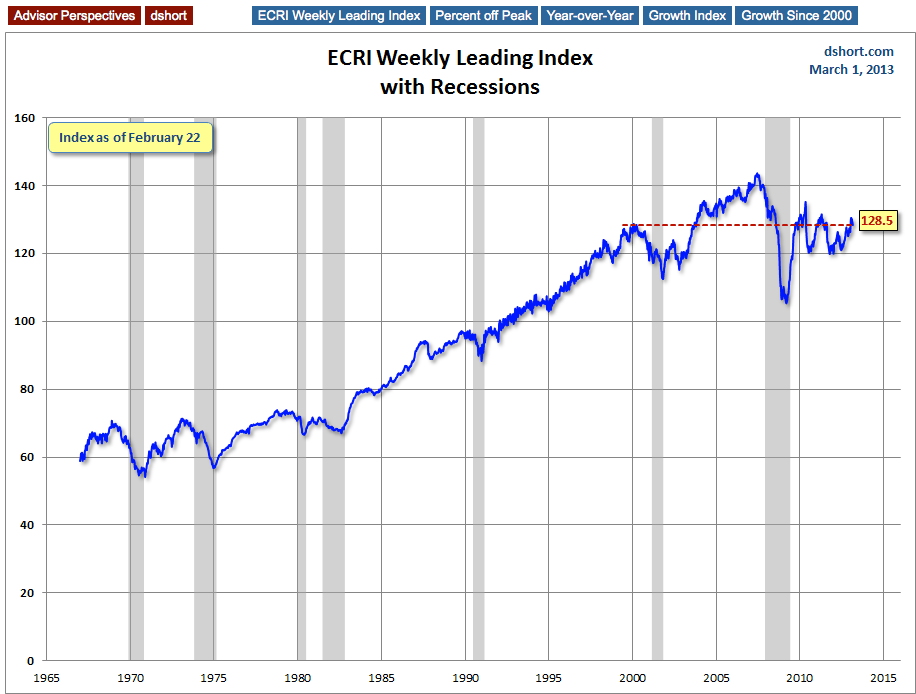
For a better understanding of the relationship of the WLI level to recessions, the next chart shows the data series in terms of the percent off the previous peak. In other words, a new weekly high registers at 100%, with subsequent declines plotted accordingly.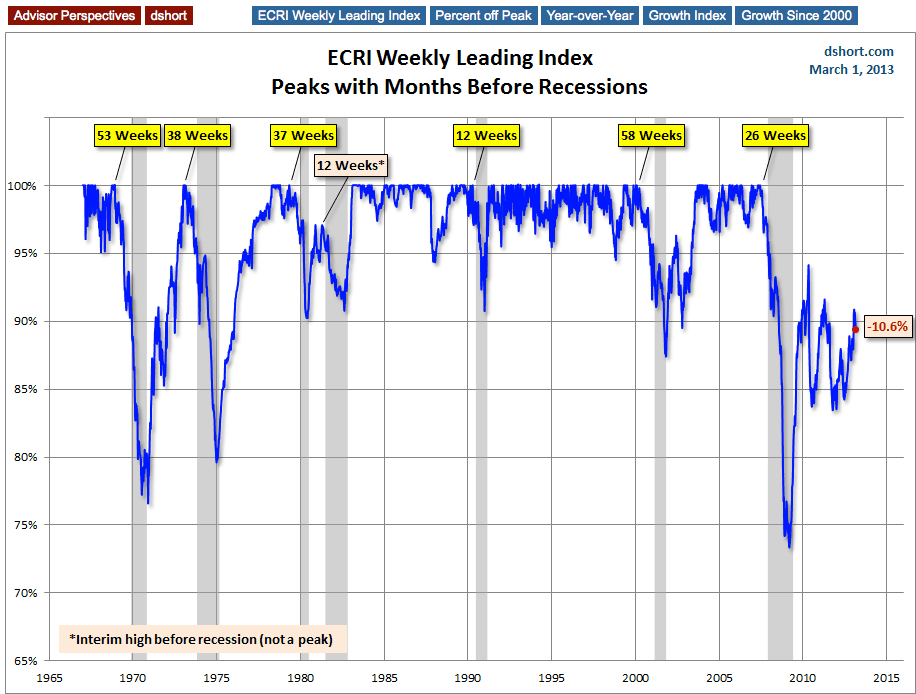
As the chart above illustrates, only once has a recession occurred without the index level achieving a new high -- the two recessions, commonly referred to as a "double-dip," in the early 1980s. Our current level is 11.9% off the most recent high, which was set over five years ago in June 2007. We're now tied with the previously longest stretch between highs, which was from February 1973 to April 1978. But the index level rose steadily from the trough at the end of the 1973-1975 recession to reach its new high in 1978. The pattern in ECRI's indictor is quite different, and this has no doubt been a key factor in their business cycle analysis.
The WLIg Metric
The best known of ECRI's indexes is their growth calculation on the WLI. For a close look at this index in recent months, here's a snapshot of the data since 2000.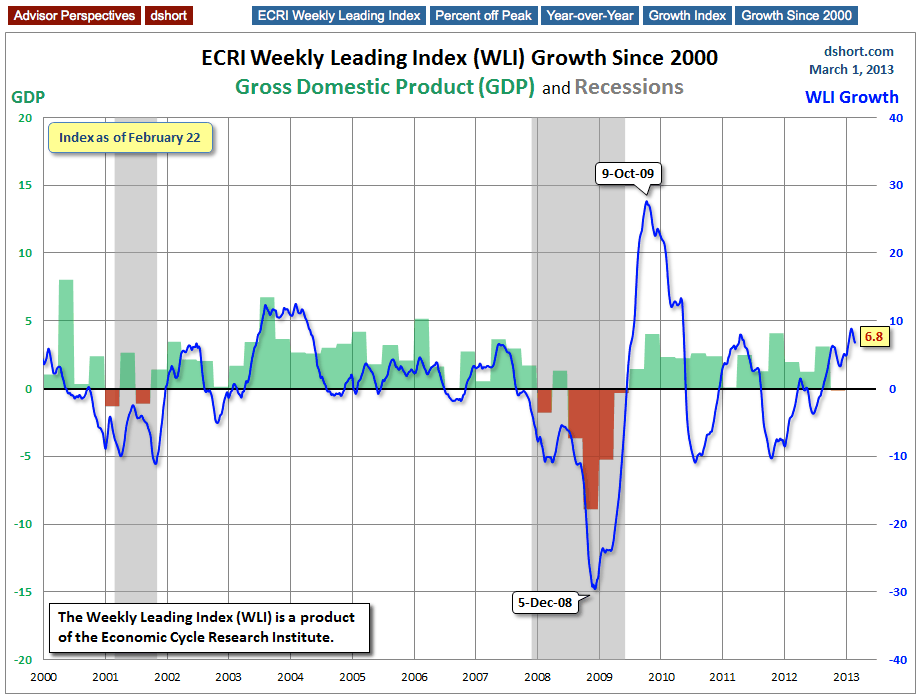
Now let's step back and examine the complete series available to the public, which dates from 1967. ECRI's WLIg metric has had a respectable record for forecasting recessions and rebounds therefrom. The next chart shows the correlation between the WLI, GDP and recessions.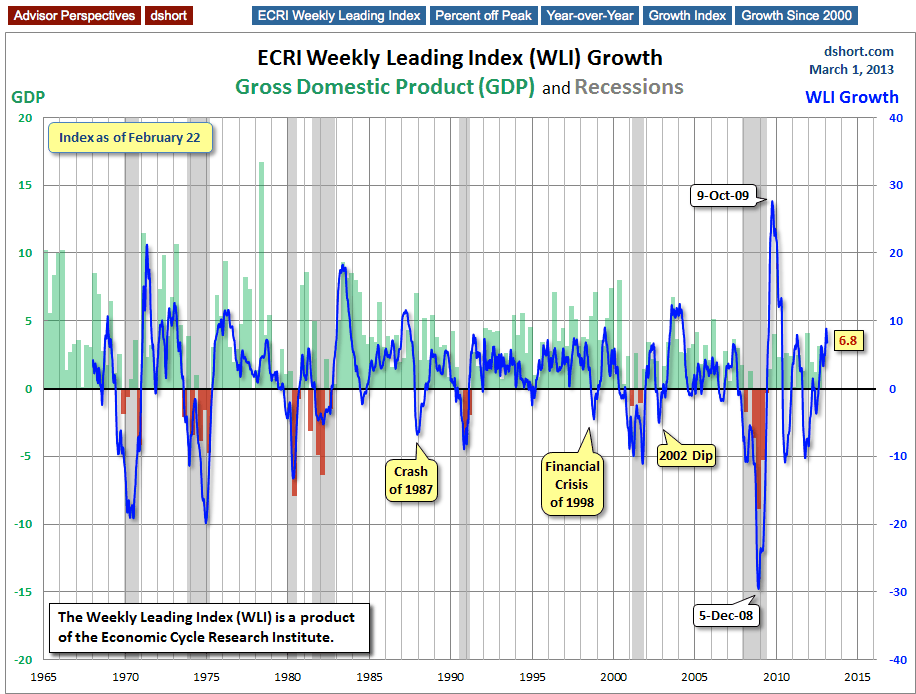
The History Of ECRI's Latest Recession Call
ECRI's weekly leading index has become a major focus and source of controversy ever since September 30th of last year, when ECRI publicly announced that the U.S. is tipping into a recession, a call the Institute had announced to its private clients on September 21st. Here is an excerpt from the announcement: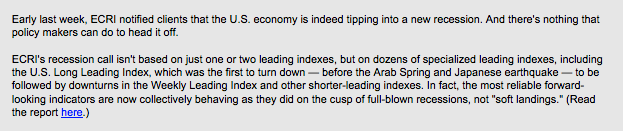
Year-over-Year Growth In The WLI
Triggered by another ECRI commentary, Why Our Recession Call Stands, I now include a snapshot of the year-over-year growth of the WLI rather than ECRI's previously favored method of calculating the WLIg series from the underlying WLI (see the endnote below). Specifically the chart immediately below is the year-over-year change in the 4-week moving average of the WLI. The red dots highlight the YoY value for the month when recessions began.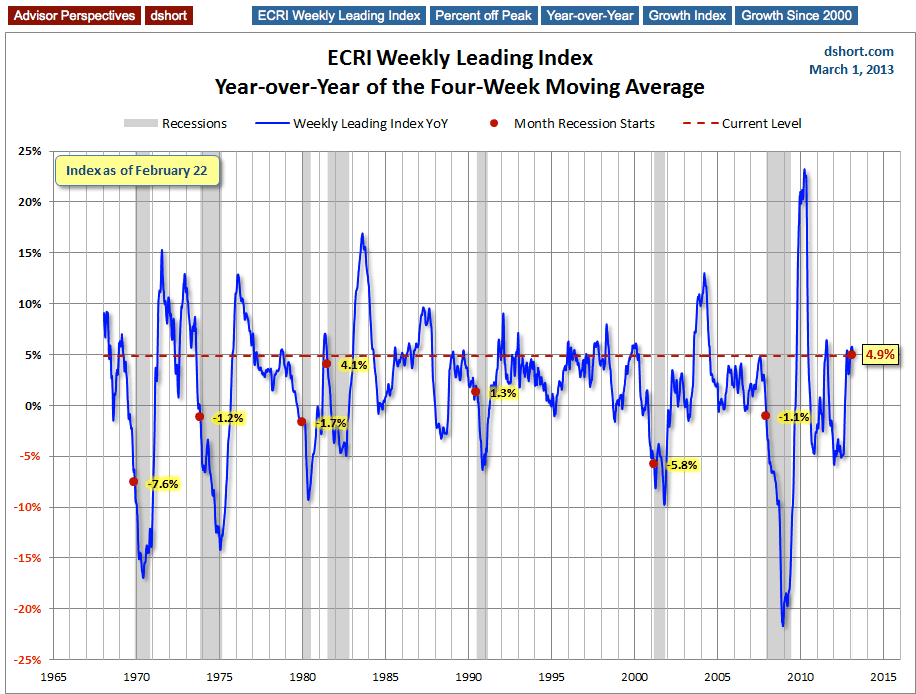
The WLI YoY, is off its interim highs at the latest reading of 4.4%. However, this is higher than at the onset of all seven recessions in the chart timeframe. The closest to the current level was the second half of the early 1980s double dip, which was to some extent an engineered recession to break the back of inflation, is a conspicuous outlier in this series, starting with a WLI YoY at 4.1%.
Additional Sources for Recession Forecasts
Dwaine van Vuuren, CEO of RecessionAlert.com, and his collaborators, including Georg Vrba and Franz Lischka, have developed a powerful recession forecasting methodology that shows promise of making forecasts with fewer false positives, which I take to include excessively long lead times, such as ECRI's September 2011 recession call.
Here is today's update of Georg Vrba's analysis, which is explained in more detail in this article.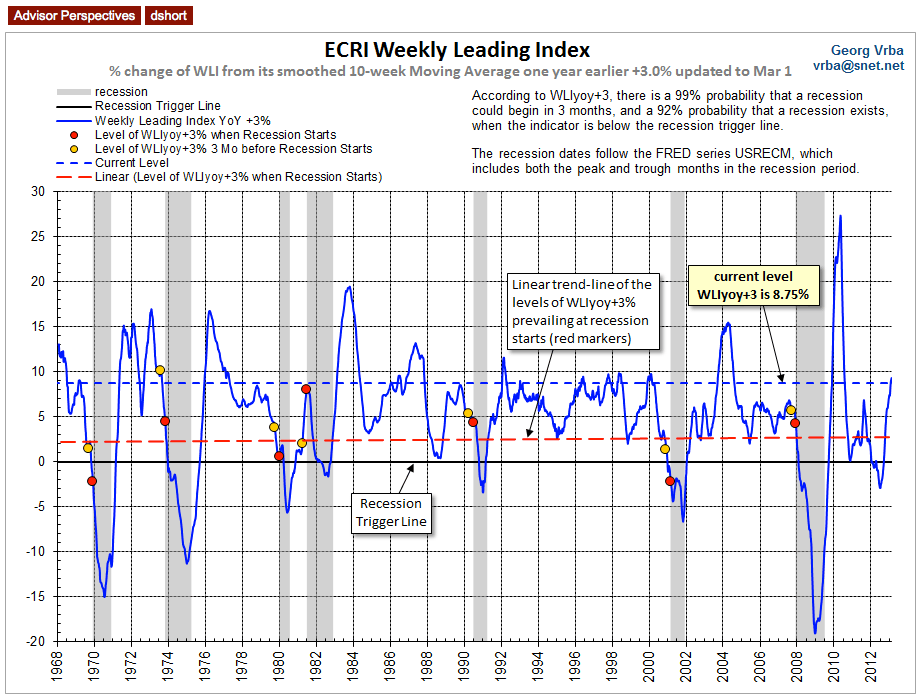
Earlier Video Chronology of ECRI's Recession Call
- September 30, 2011: Recession Is "Inescapable" (link)
- September 30, 2011: Tipping into a New Recession (link)
- February 24, 2012: GDP Data Signals U.S. Recession (link)
- May 9, 2012: Renewed U.S. Recession Call (link)
- July 10, 2012: "We're in Recession Already" (link)
- September 13, 2012: "U.S. Economy Is in a Recession" (link)
ECRI's weekly Excel spreadsheet includes the WLI and the Growth series, but the latter is a series of values without the underlying calculations. After a collaborative effort by Franz Lischka, Georg Vrba, Dwaine van Vuuren and Kishor Bhatia to model the calculation, Georg discovered the actual formula in a 1999 article published by Anirvan Banerji, the Chief Research Officer at ECRI: The three Ps: simple tools for monitoring economic cycles - pronounced, pervasive and persistent economic indicators.
Here is the formula: "MA1" = 4 week moving average of the WLI
"MA2" = moving average of MA1 over the preceding 52 weeks
"n"= 52/26.5
"m"= 100
WLIg = [m*(MA1/MA2)^n] – m