Now that we’ve had the 5% pullback we anticipated in recent weeks, many pundits are once again prognosticating the “beginning of the end.” When you dig under the surface however, the clearer story looks like “the end of the beginning” and most stocks are just at the starting gate of major cyclical recoveries.
Here are a few we have discussed in previous podcast|videocast(s):
As I have stated before, the key to making big money in this business is “zooming OUT.” When you get caught up in the short term noise, it takes you out of many of the best companies whose recoveries can be doubles, triples and more in reasonable time frames (over a few years).
Do these stocks (below) look like they are near a top or just beginning a multi-year recovery (in no particular order)? If you feel like you missed the rally, or if there’s nowhere to put new money to work, you’ve got what we gently refer to as “stinkin’ thinkin’!” You’ve been watching too many clickbait bears on TV, and it costs you a lot of money to listen to them. Some of these companies have taken off already, but most are just coming out of the starting gate and nowhere near intrinsic value/full recovery (opinion, not advice).
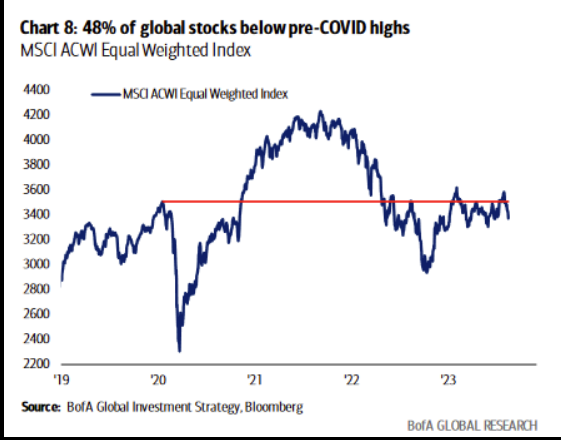
You need only look at the chart of the All Country World index below to see the percent of stocks BELOW their pre-pandemic highs.
If your hedge fund manager or money manager can’t consistently find quality businesses on sale (and have the fortitude/experience/knowledge to stick with them through the short term volatility – until price reaches or exceeds intrinsic value), hire someone who can. Many of you have done just that in recent days, weeks and months and we are grateful for that! The smartest (most successful) people in the world focus on that they do best (build their businesses/careers) and outsource the rest.
They know that even if you THINK you have all of the ingredients, unless you know how to mix them in the right proportions and know when to take each one out of the oven (from years of experience), you’re not going to produce world-class cookies (results).
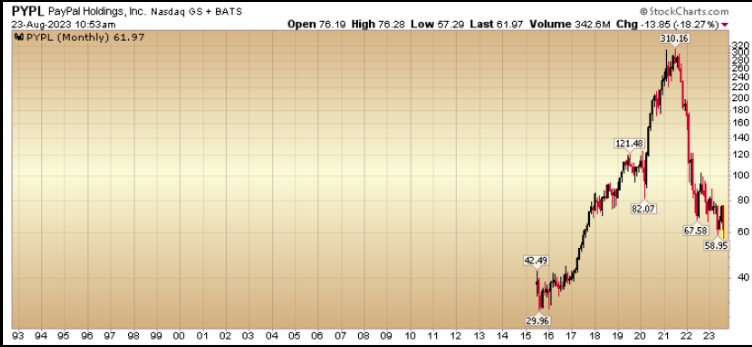
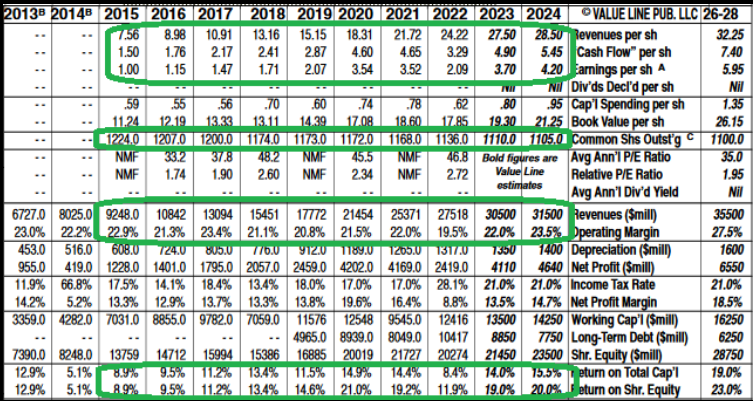
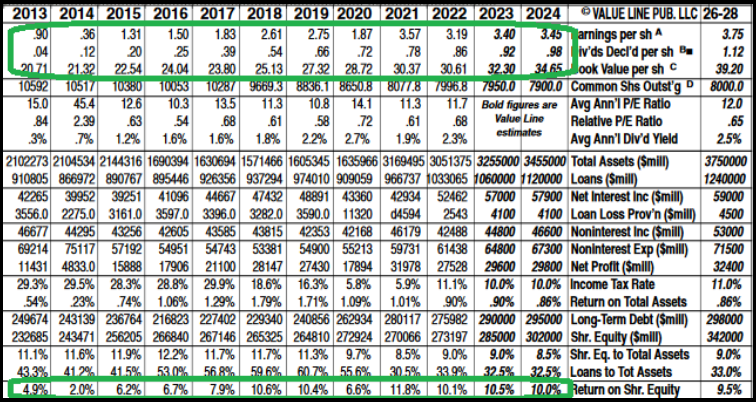
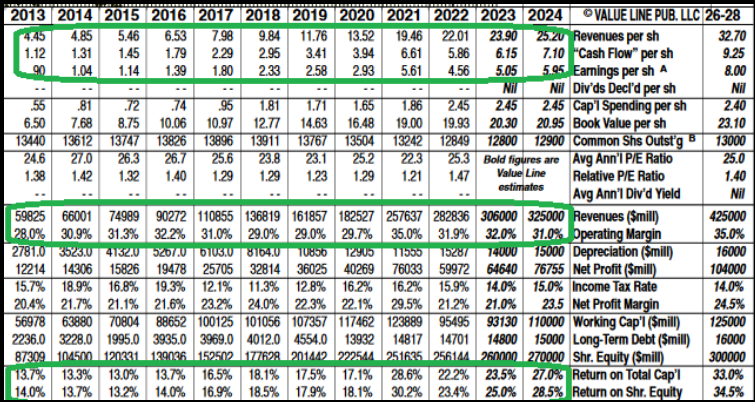
PYPL (PRICE fell ~81% from peak, not Earnings Power or Revenue)
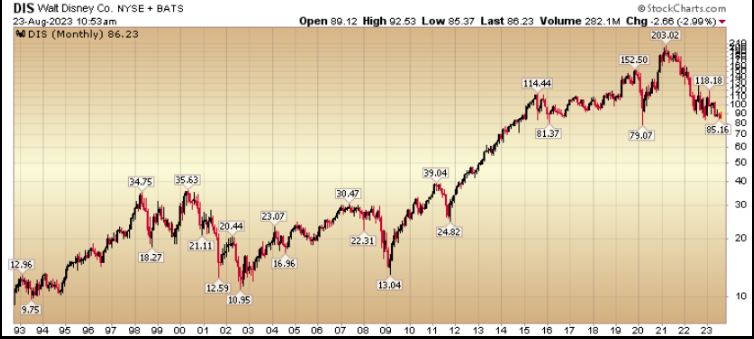
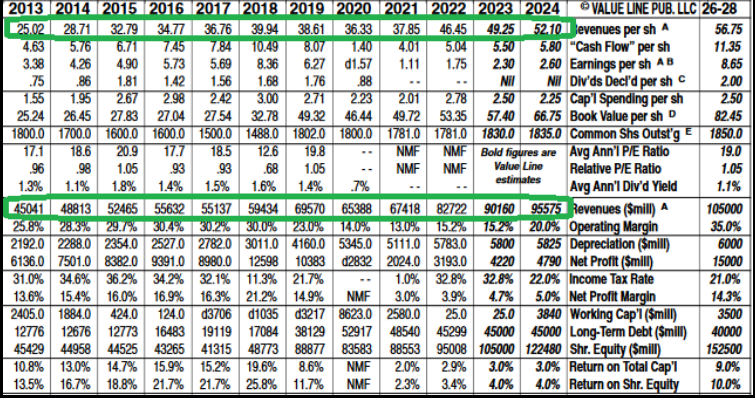
DIS (PRICE fell ~58% from peak, not Earnings Power or Revenue)
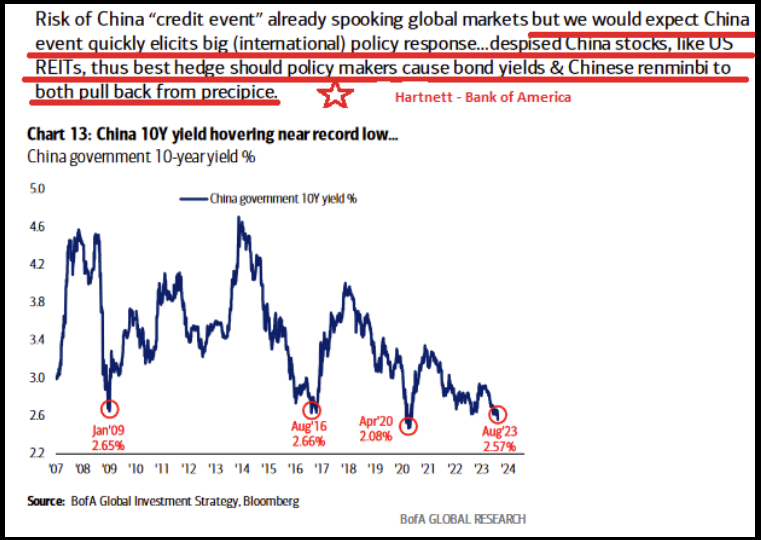
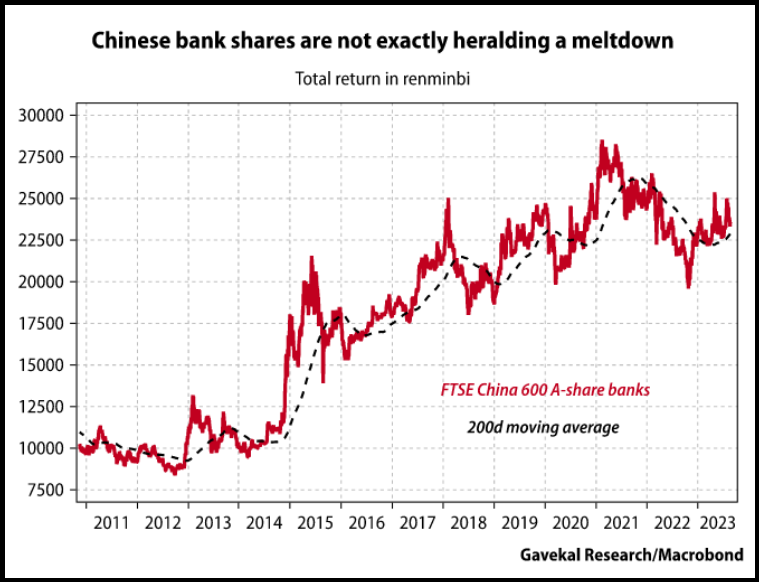
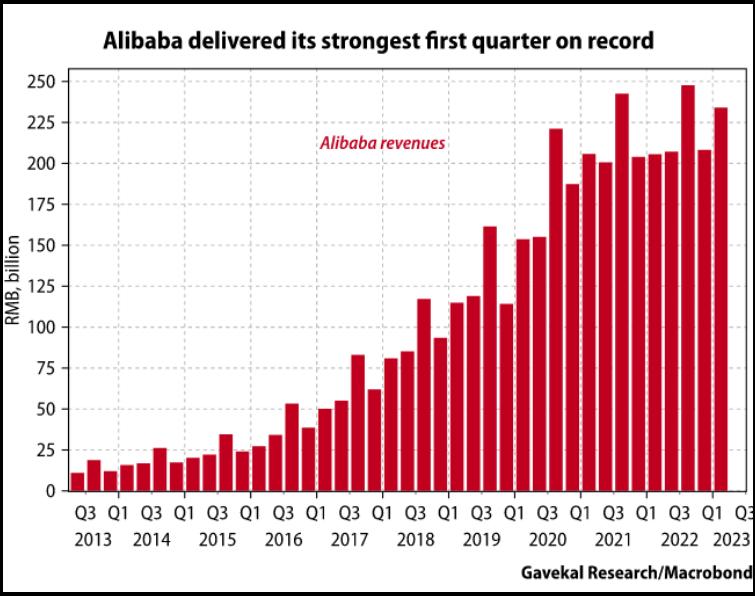
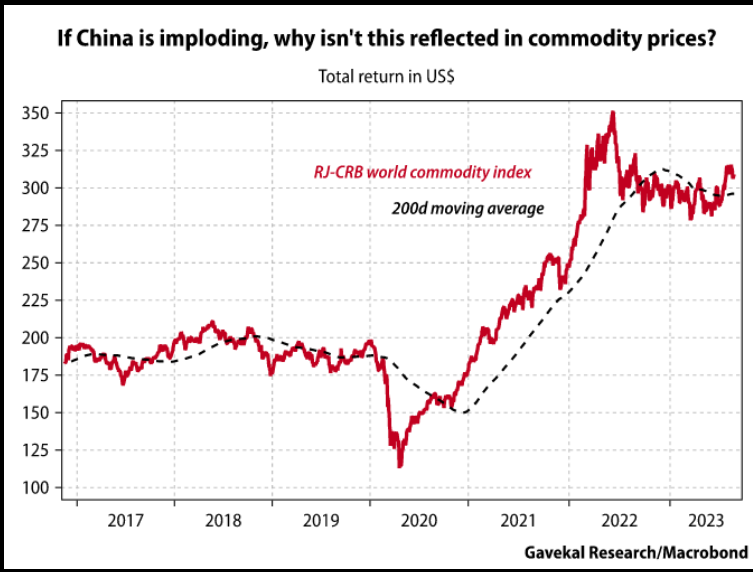
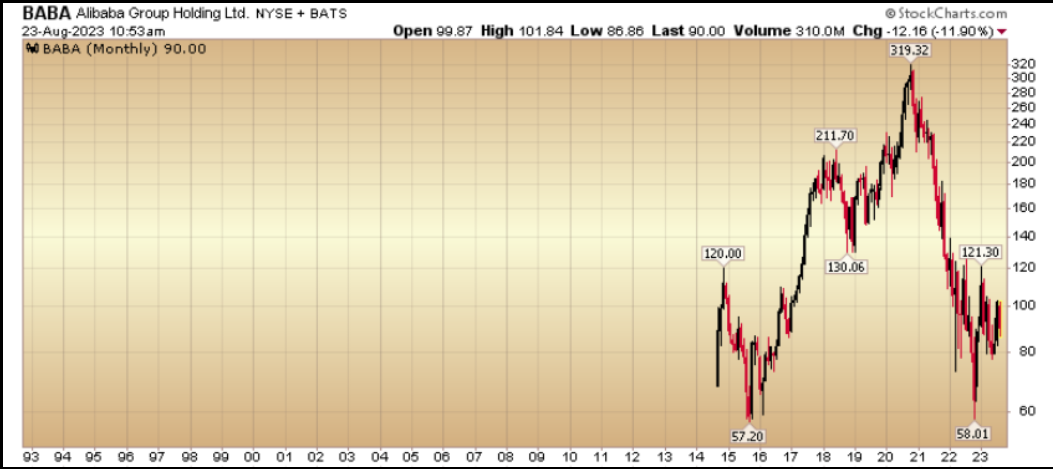
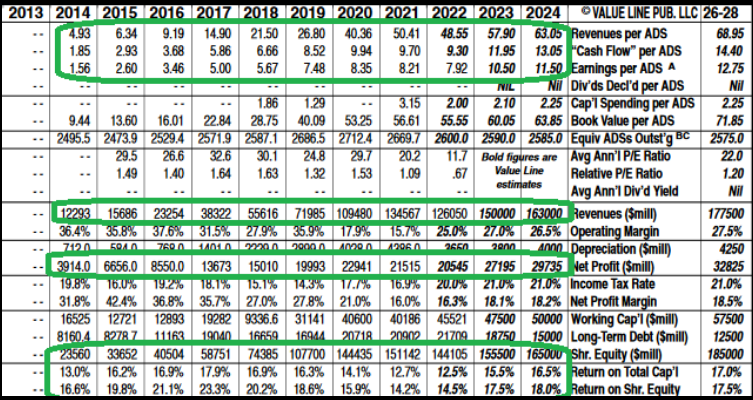
BABA (PRICE fell ~82% from peak, not Earnings Power or Revenue)
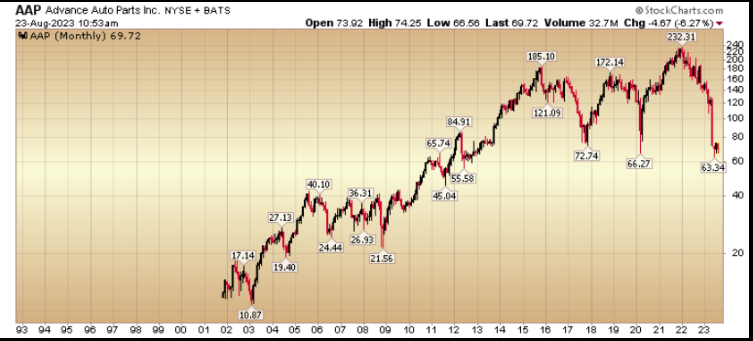
AAP (PRICE fell ~72% from peak, not Earnings Power or Revenue)
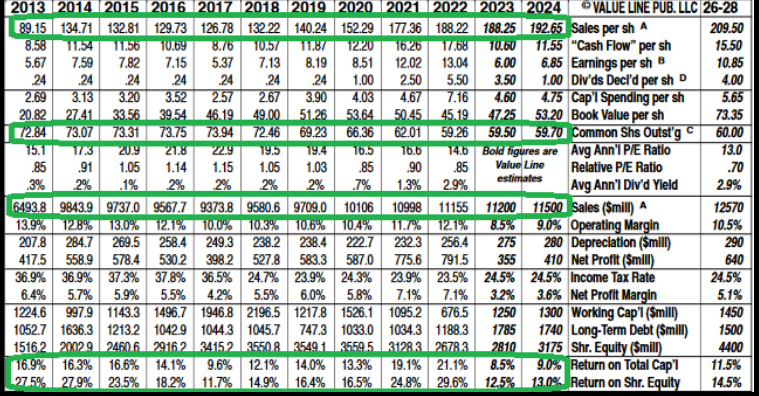
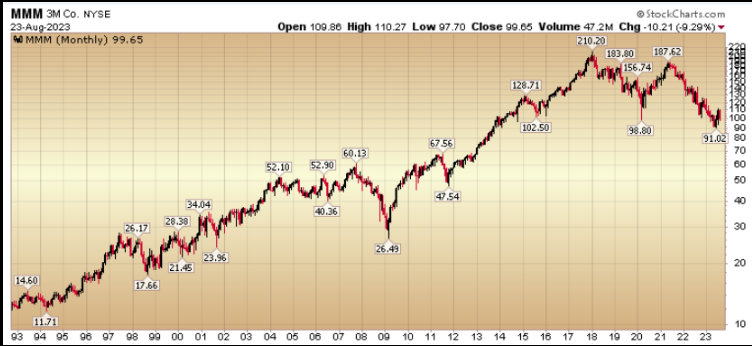
CPS (PRICE fell ~97% from peak, not Revenue)
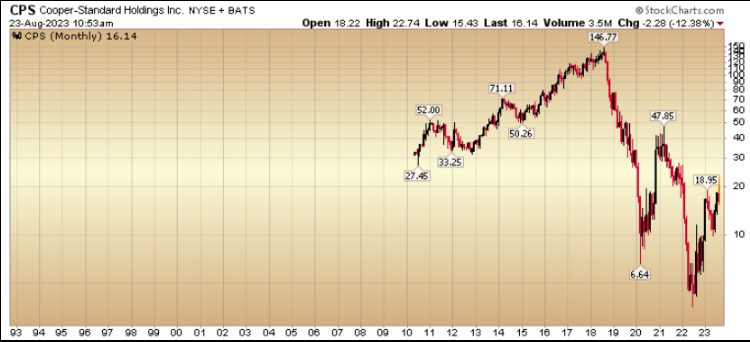
MMM (PRICE fell ~57% from peak, not Earnings Power or Revenue)
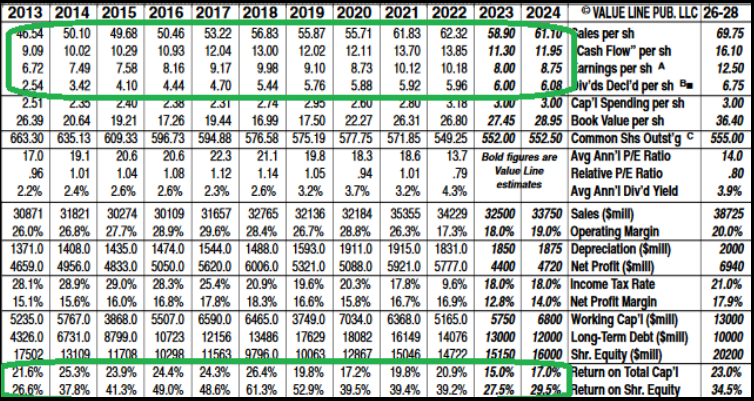
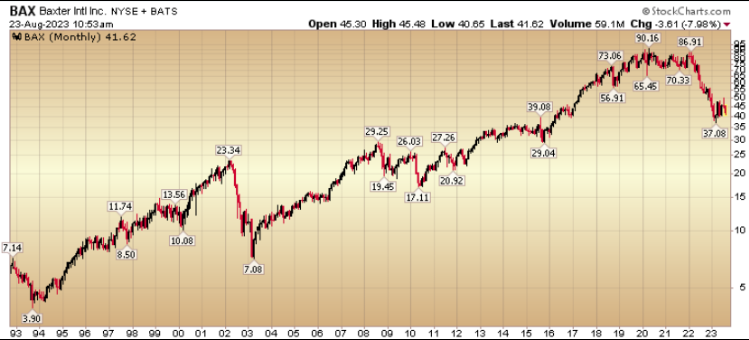
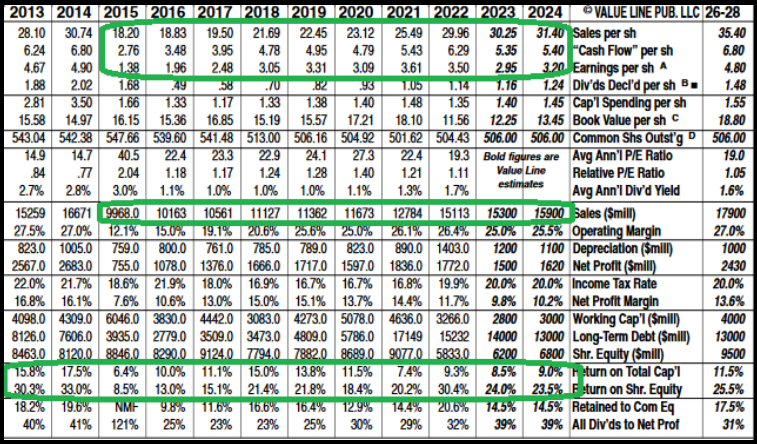
BAX (PRICE fell ~59% from peak, not Earnings Power or Revenue)
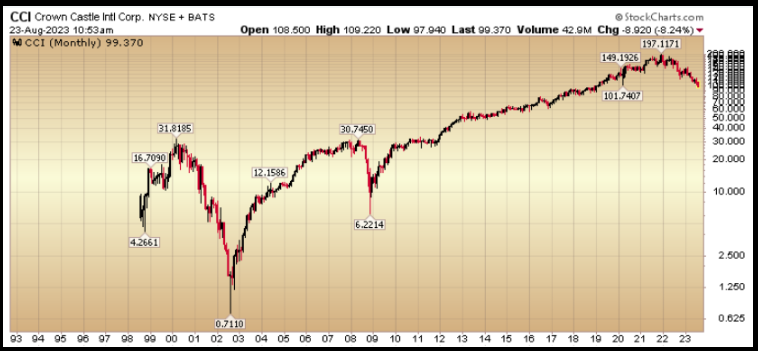
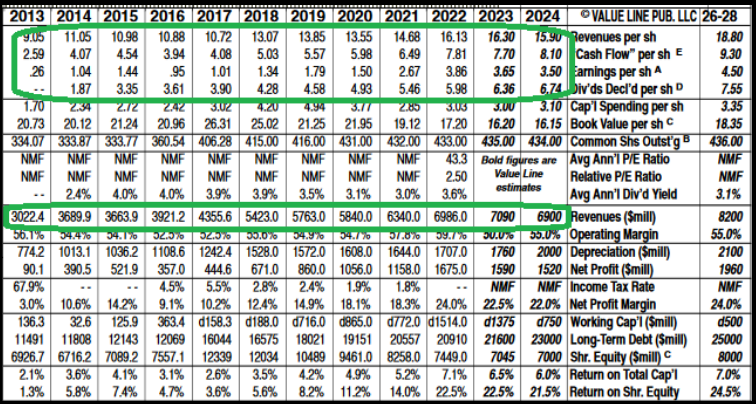
CCI (PRICE fell ~51% from peak, not Earnings Power or Revenue)
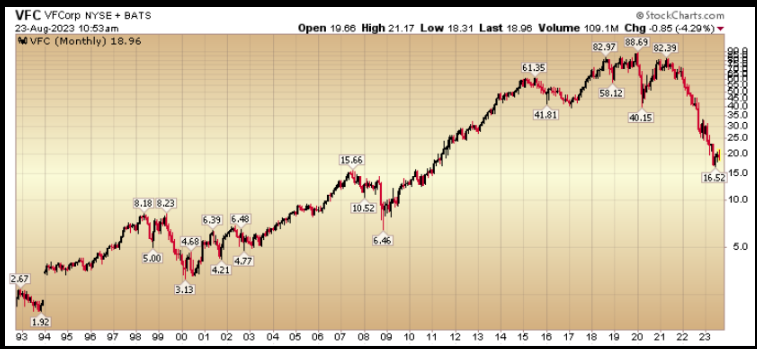
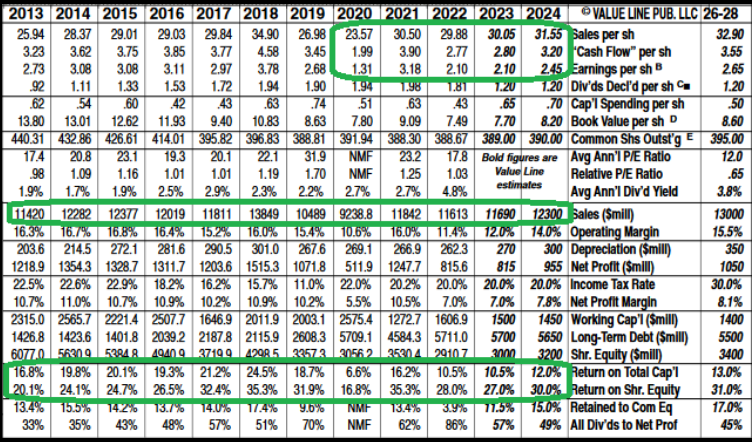
VFC (PRICE fell ~81% from peak, not Earnings Power or Revenue)
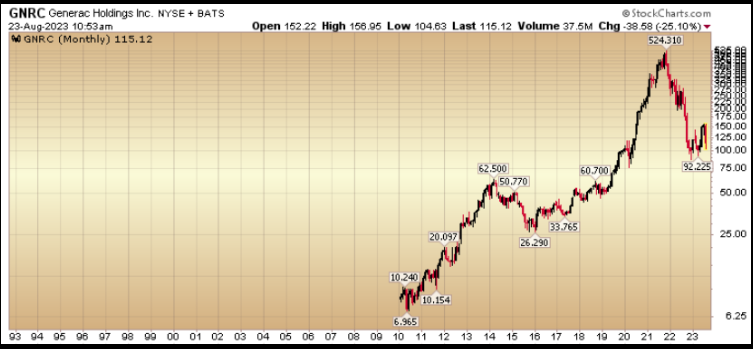
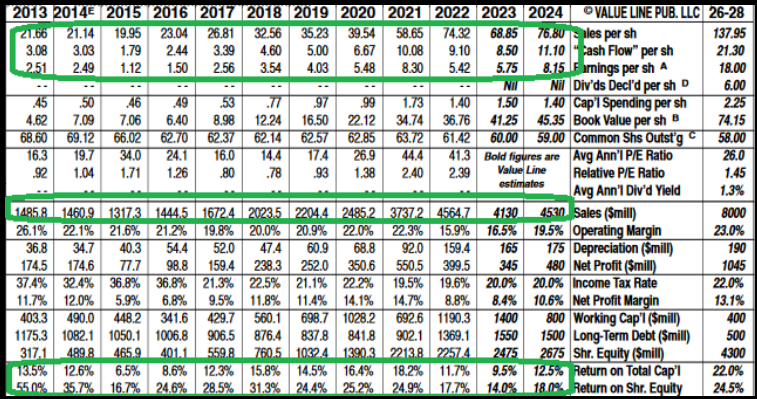
GNRC (PRICE fell ~83% from peak, not Earnings Power or Revenue)
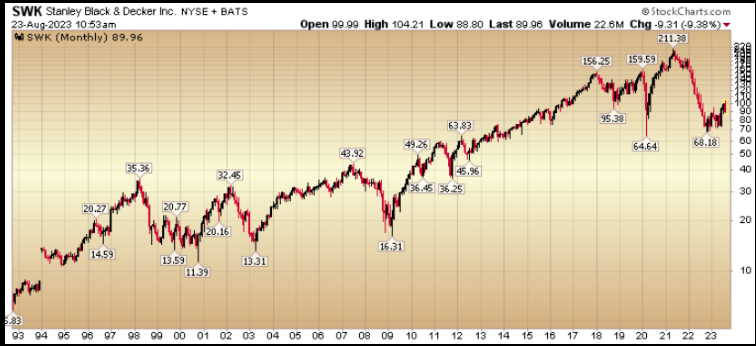
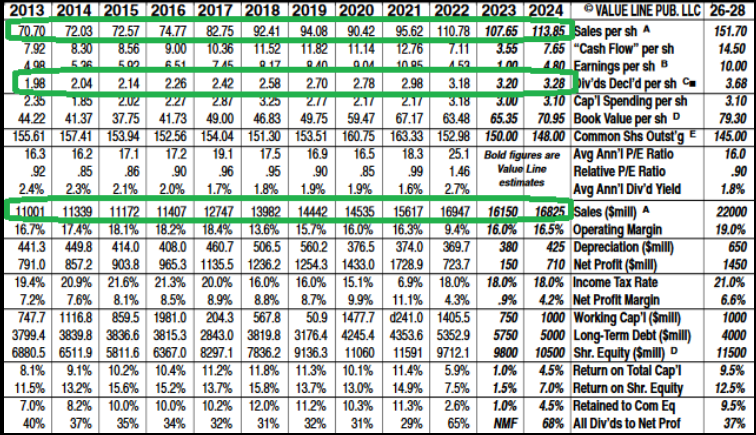
SWK (PRICE fell ~68% from peak, not Earnings Power or Revenue)
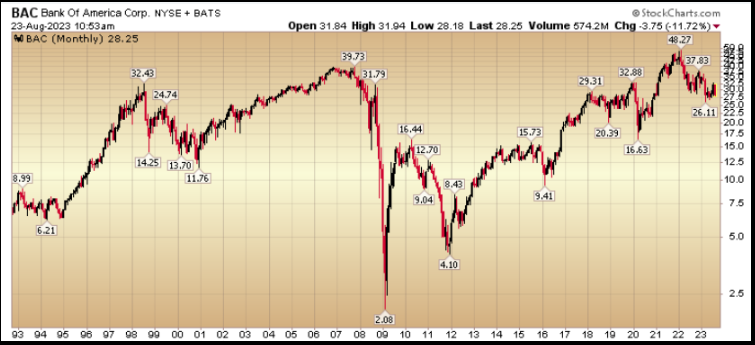
BAC (PRICE fell ~46% from peak, not Earnings Power or Revenue)
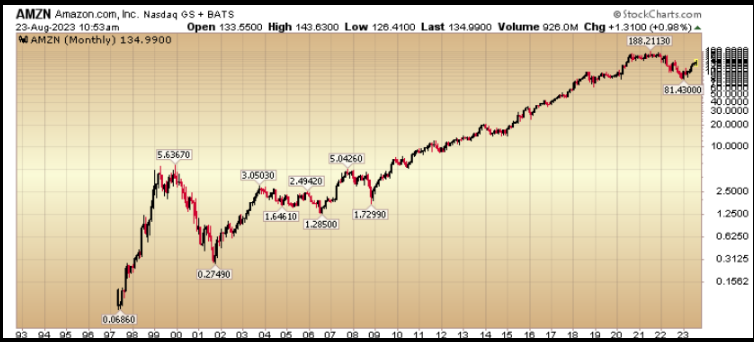
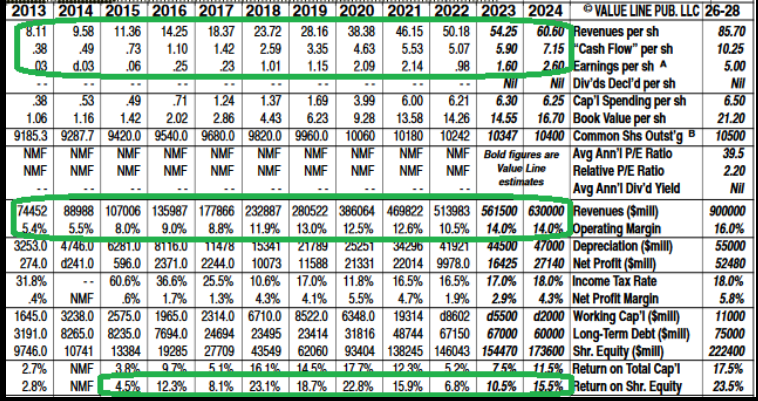
AMZN (PRICE fell ~57% from peak, not Earnings Power or Revenue)
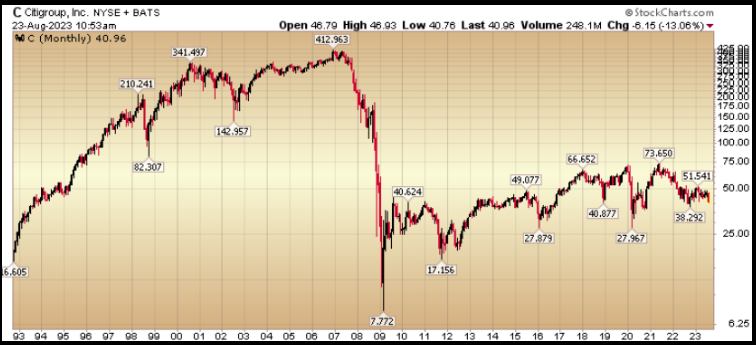
C (PRICE fell ~48% from recent peak, not Earnings Power or Revenue)
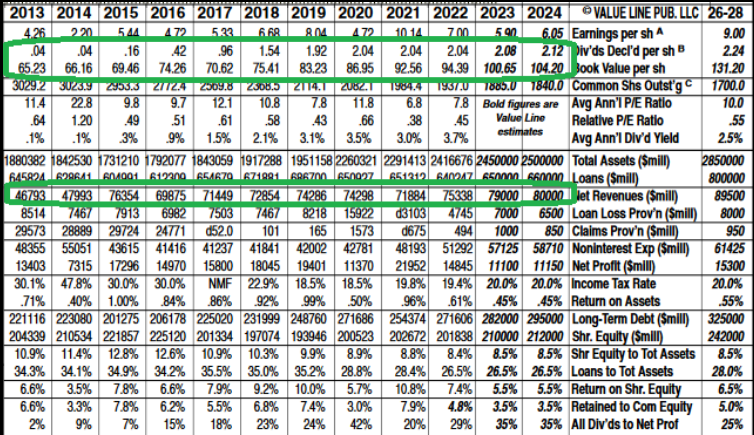
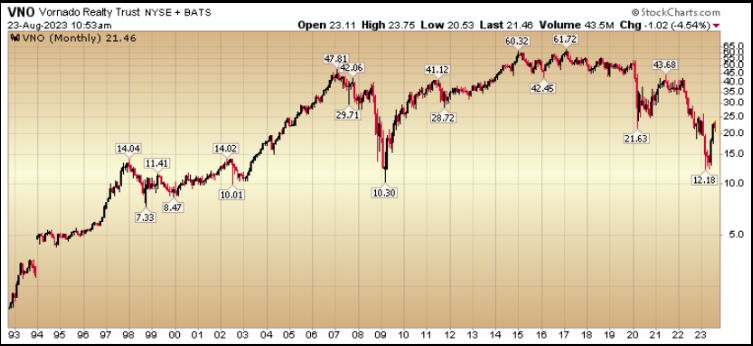
VNO (PRICE fell ~80% from peak, not Earnings Power or Revenue)
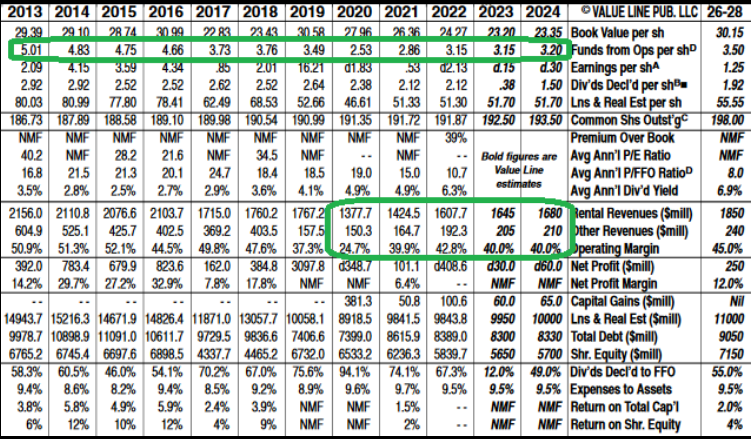
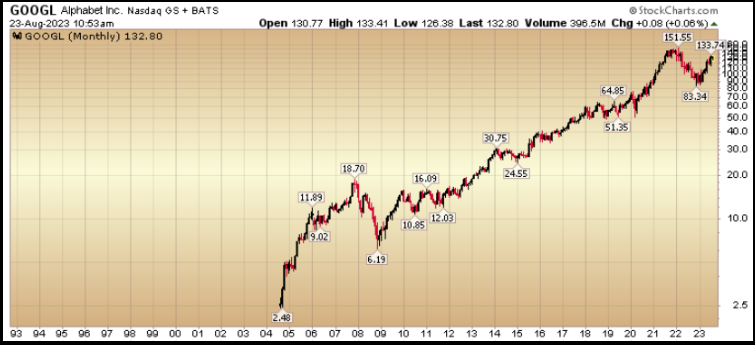
GOOGL (PRICE fell ~45% from peak, not Earnings Power or Revenue)
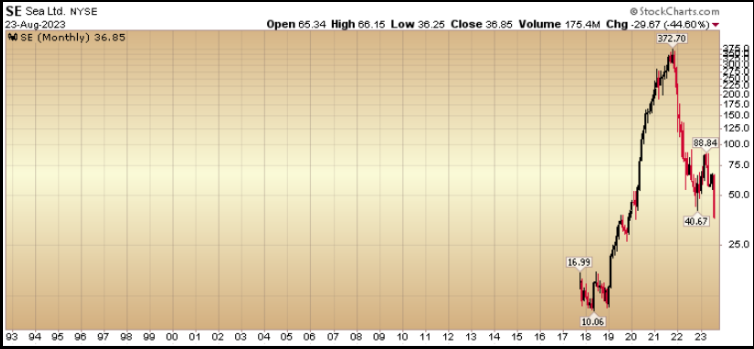
SE (PRICE fell ~90% from peak, not Earnings Power or Revenue)
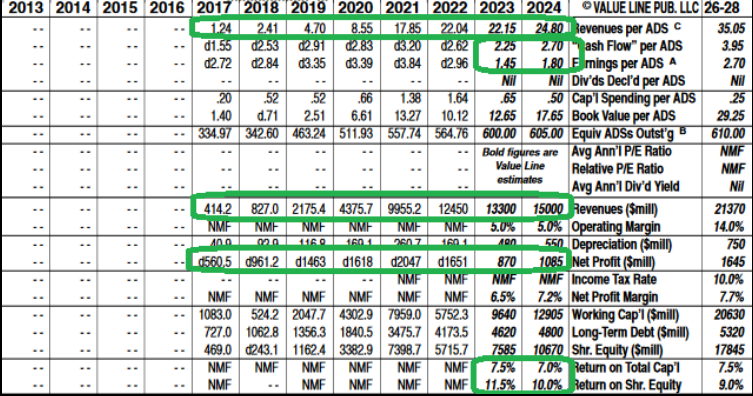
XBI (PRICE fell ~65% from peak)
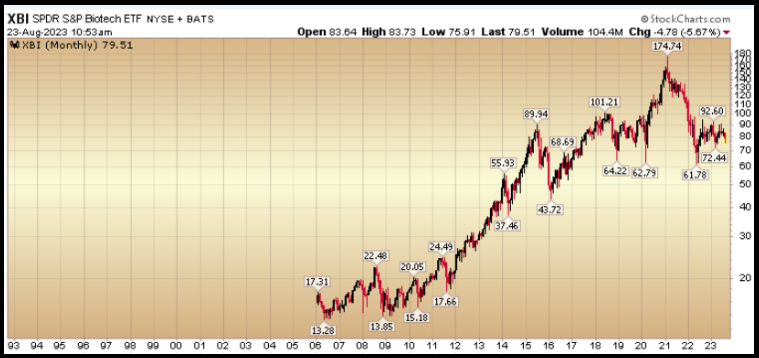
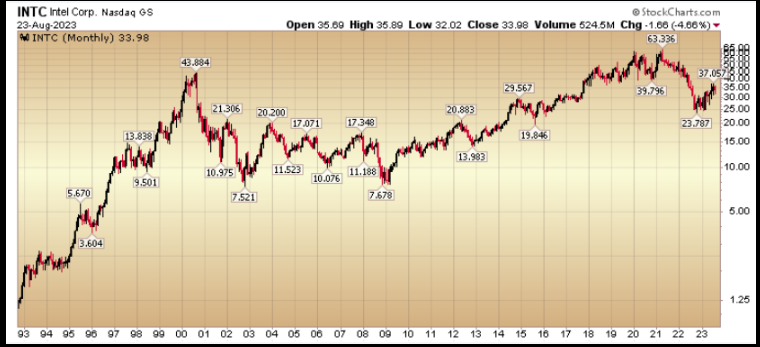
INTC (PRICE fell ~62% from peak)
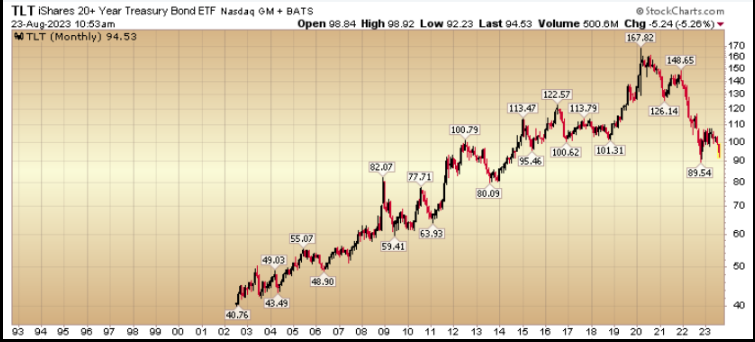
TLT (PRICE fell ~47% from peak)
The perma-bears on TV are like the birds in a farmer’s field. The birds take a bit of the crop from time to time (cause short-term volatility), but if you spend all of your days chasing (paying attention to) the “negative” birds, it takes you out of the field from planting your seeds (gaining an abundant future harvest). Focus on taking advantage of once in a generation opportunities and ignore the short-term noise.
The negative ne’er–do–wells never wind up with much money in the long term (even those who get lucky on one or two trades in a career). They sound the “smartest” on TV but earn the least over time. Fortunes are made consistently buying high-quality, cash-generative businesses/assets – when they are out of favor (and holding them through volatility until they reach or exceed full intrinsic value) – not predicting the next apocalypse. Those gamblers who hit on the roulette wheel once in a career (predicting a crash) have a tendency to give it all back to the casino over time because their process was never durable or repeatable. Not to mention, the “end of the world” only comes once!
For those of you buying the negative narrative, there are DOZENS of stocks like the ones above we are currently working on for new money and when some of these hit our fair value targets and are harvested. This condition will not last forever, but we are constructive on markets as far as the eye can see:
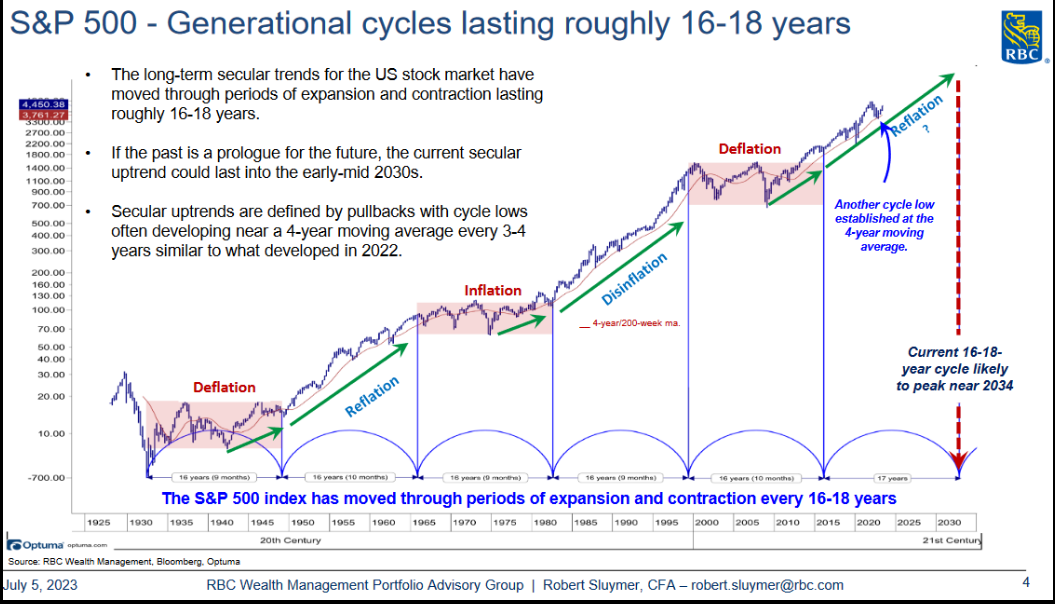
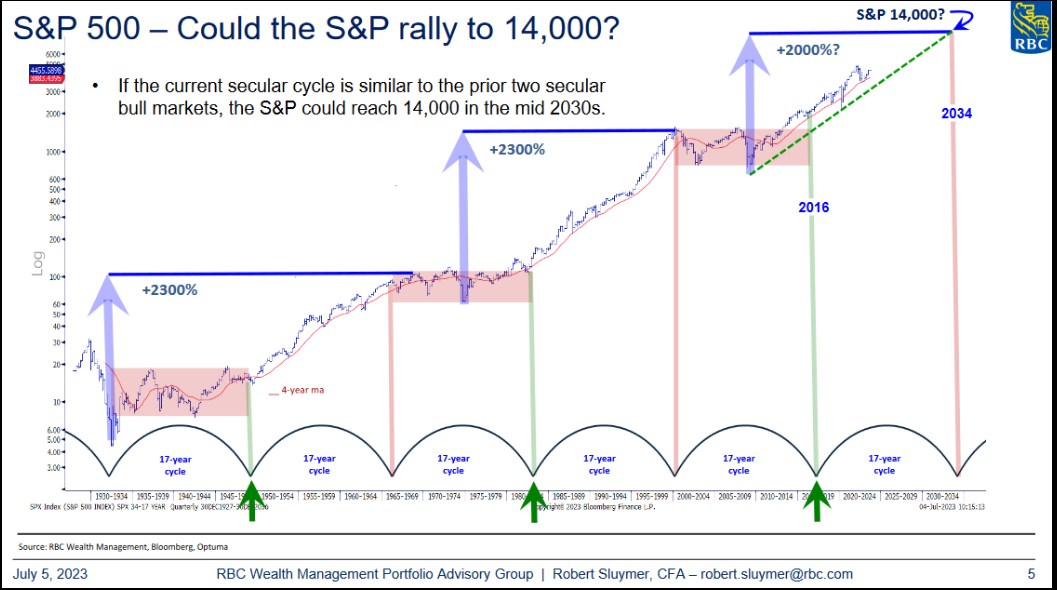
Summary: Expect bouts of volatility on the surface, look for opportunities under the surface. Rinse, repeat…
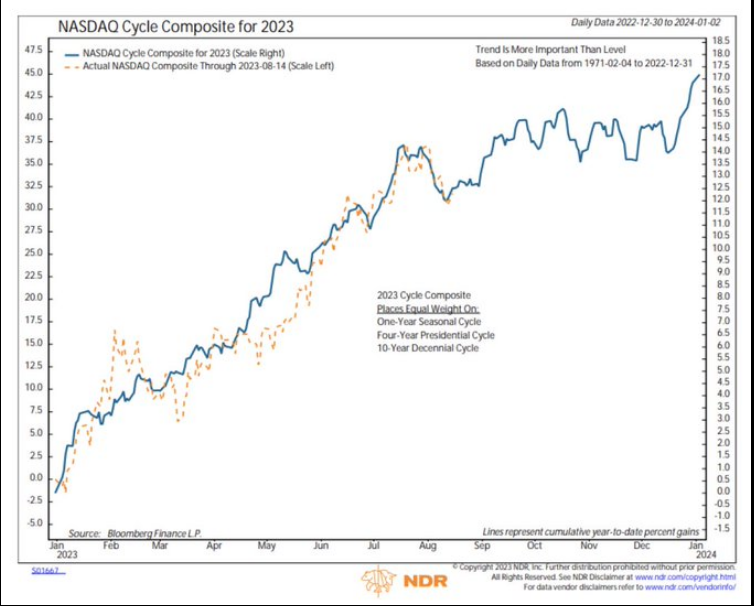
Now onto the shorter term view for the General Market:
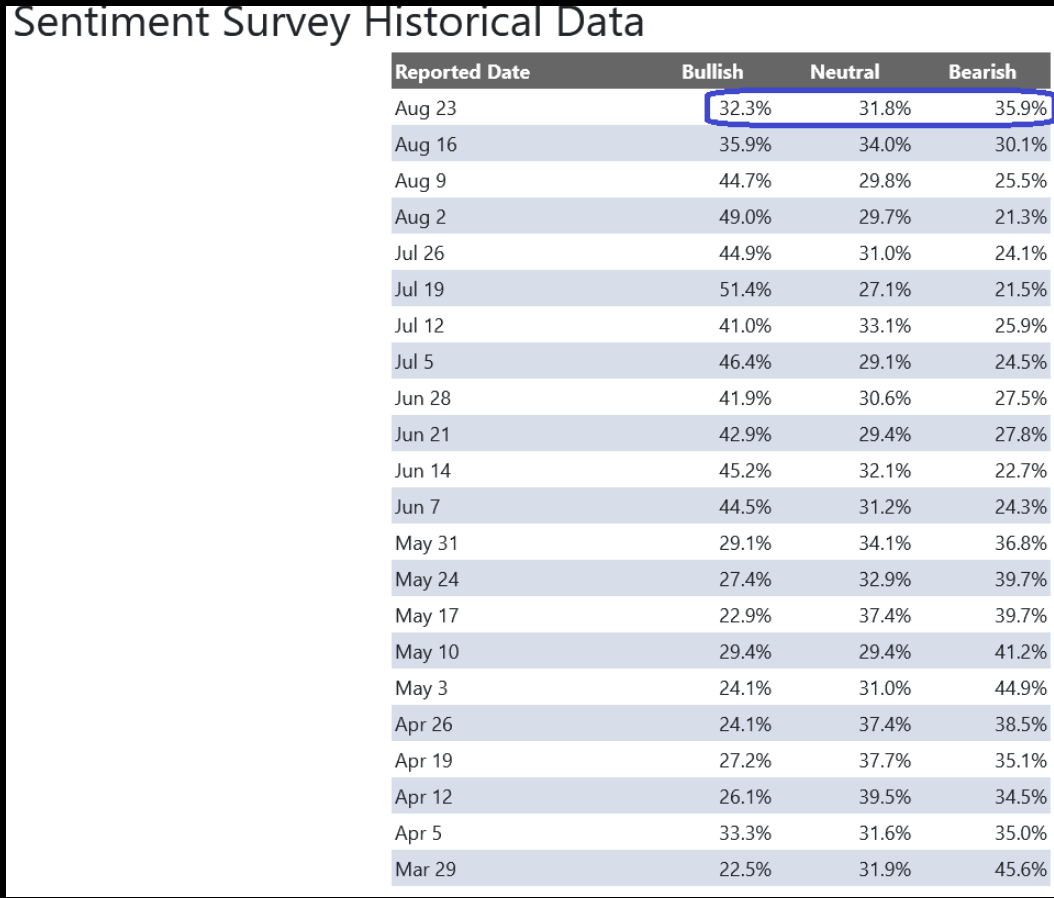
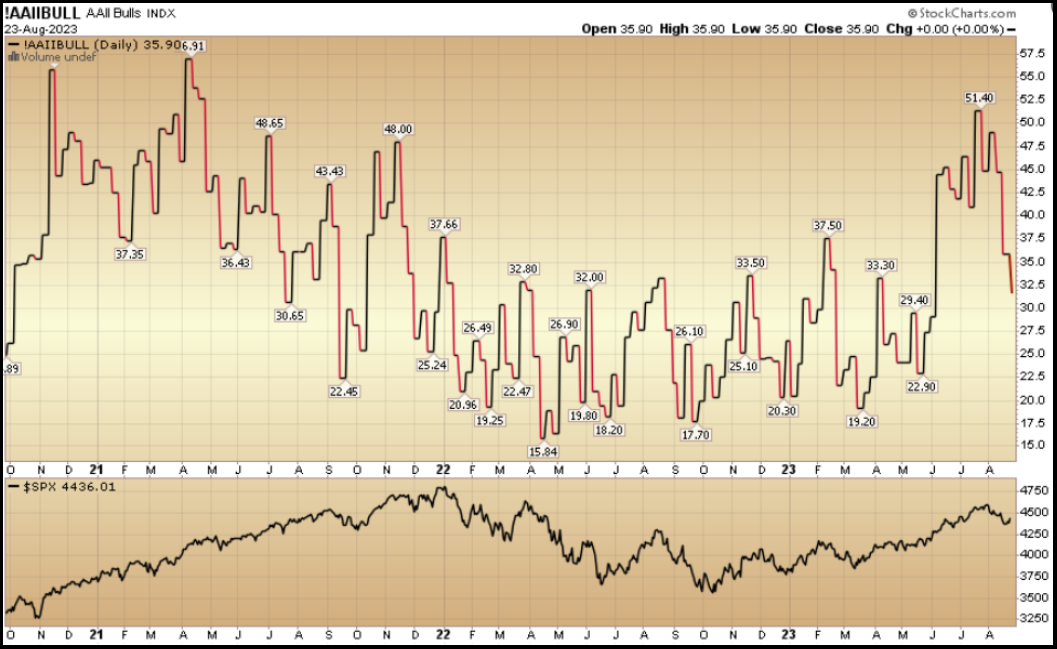
In this week’s AAII Sentiment Survey result, Bullish Percent (Video Explanation) dropped to 32.3% from 35.9% the previous week. Bearish Percent rose to 35.9% from 30.1%. The retail investor is showing some renewed trepidation.
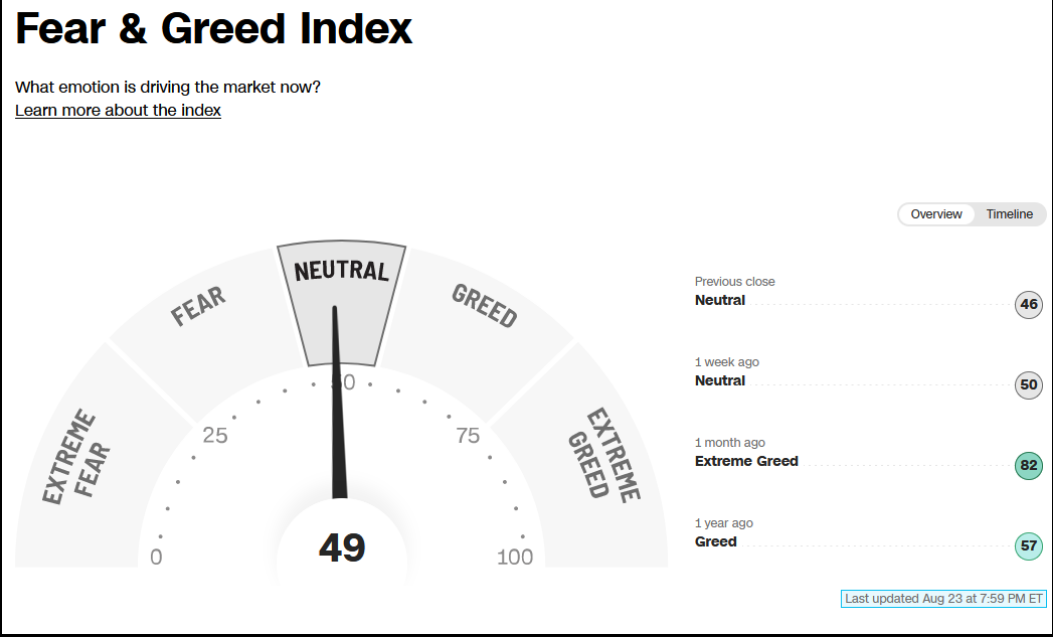
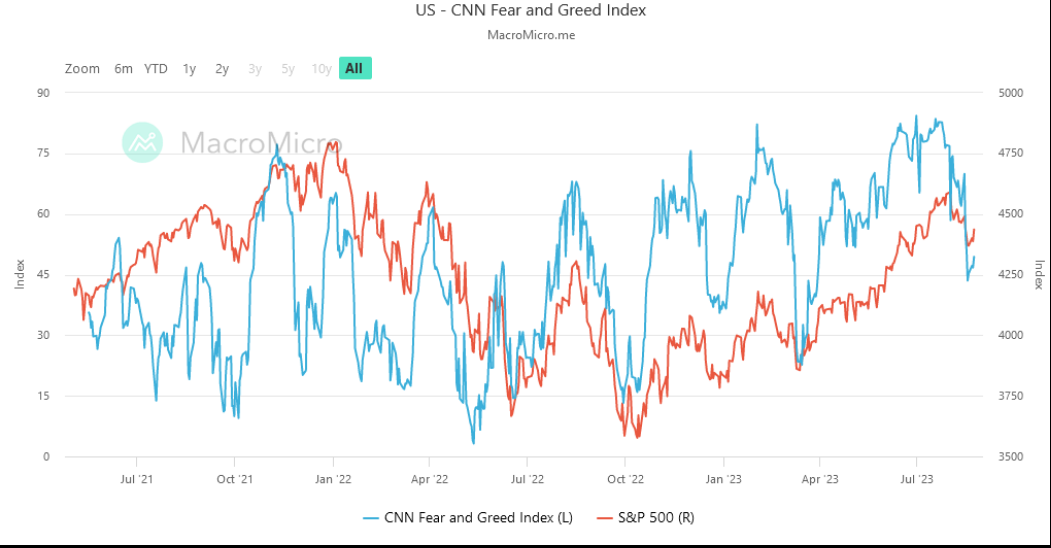
The CNN “Fear and Greed” dropped from 52 last week to 49 this week. You can learn how this indicator is calculated and how it works here: (Video Explanation)
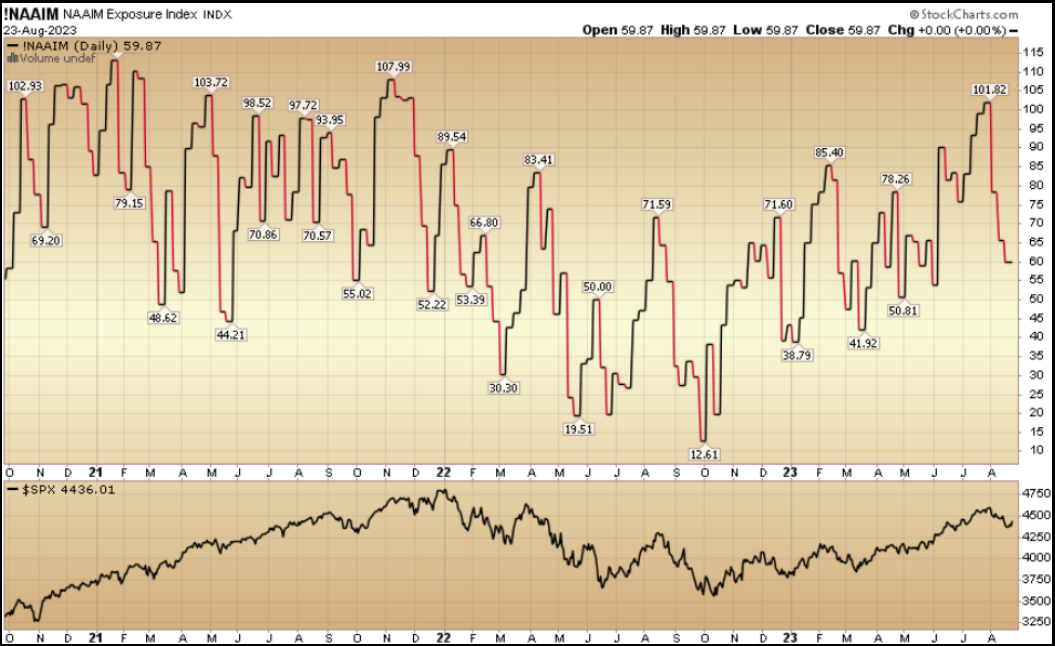
And finally, the NAAIM (National Association of Active Investment Managers Index) (Video Explanation) dropped to 59.87% this week from 65.49% equity exposure last week.
This content was originally published on Hedgefundtips.com.

