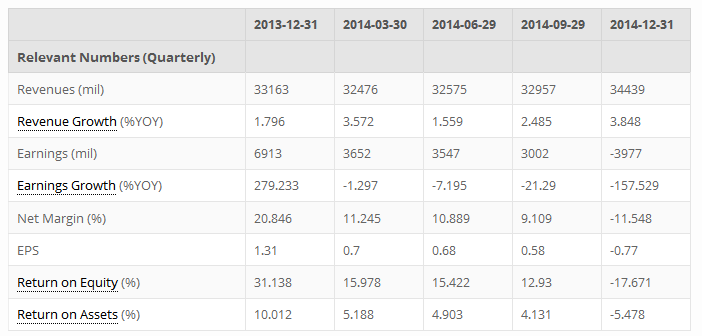
AT&T (NYSE:T) reports preliminary financial results for the quarter ended December 31, 2014. AT&T reported a net loss of $3.9 B compared with a $6.9 B profit a year ago due to a one-time pension-related accounting charge. Revenue rose 3.8 percent to $34.4 B.
The company is under pressure from peers T-Mobile (NYSE:TMUS), Sprint (NYSE:S), and Verizon Communications (NYSE:VZ), which are looking to convert its customers. Q4 monthly service cancellations notched higher to 1.2 percent from 1.1 percent a year earlier, as rivals’ promotional deals prompted customers to switch carriers. Apart from the wireless carriers, Google (NASDAQ:GOOGL) is working to offer wireless services, and Cablevision (NYSE:CVC) will offer service through its Wi-Fi hot spots network. AT&T also spent heavily in the past year to upgrade its wireless and wired networks.
In response, AT&T has moved its customer base to cheaper plans and announced deals to expand into Mexico and expand satellite television provider Direct TV.
This earnings release follows the earnings announcements from the following peers of AT&T Inc. –Verizon (NYSE:VZ) and Time Warner Cable (NYSE:TWC).
Highlights
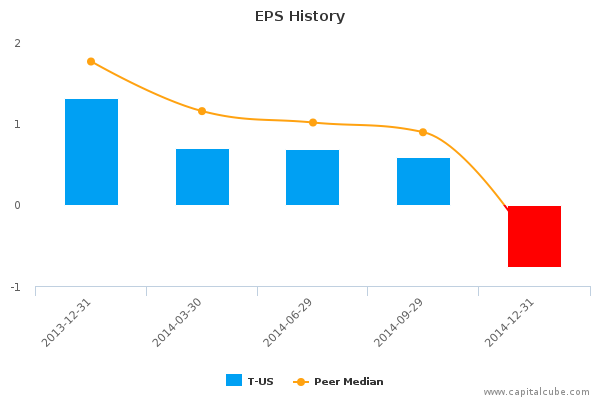
- Summary numbers: Revenues of $34.44 billion, Net Earnings of $ -3.98 billion, and Earnings per Share (EPS) of $ -0.77.
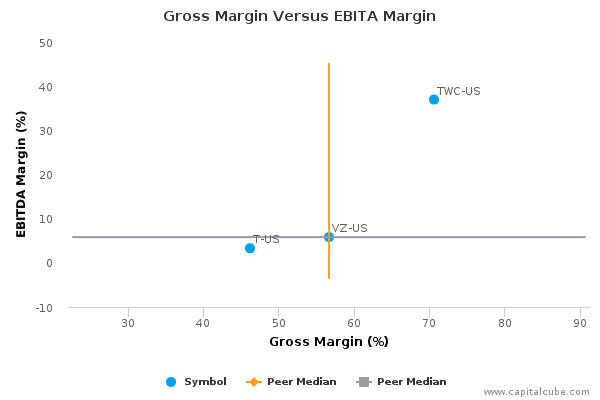
- Gross margins narrowed from 63.10% to 46.17% compared to the same quarter last year, operating (EBITDA) margins now 3.30% from 51.01%.
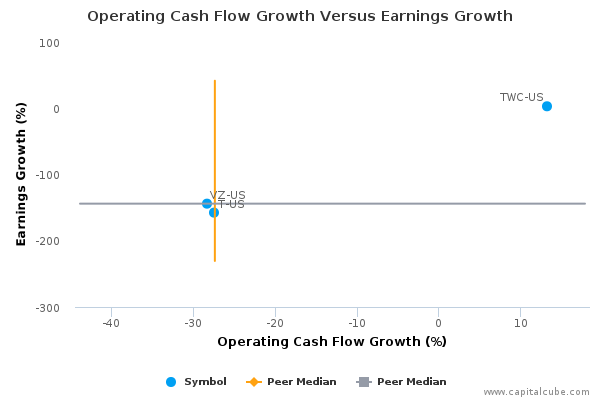
- Ability to declare a higher earnings number? Change in operating cash flow of -27.43% compared to same quarter last year better than change in earnings.
- Narrowing of operating margins contributed to decline in earnings.
The table below shows the preliminary results and recent trends for key metrics such as revenues and net income growth:
Market Share Versus Profits
Companies sometimes focus on market share at the expense of profits or earnings growth.
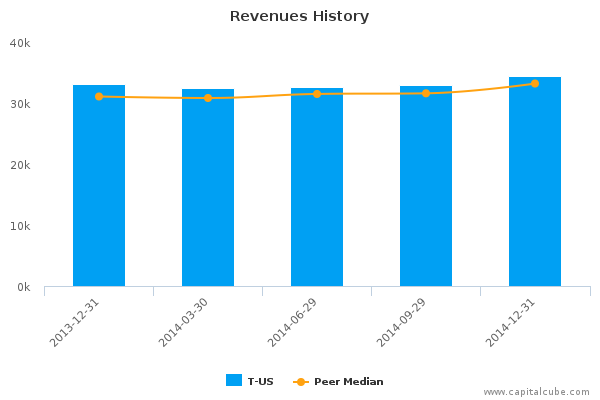
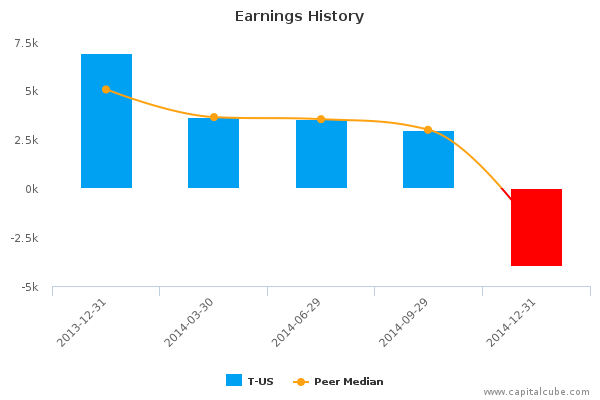
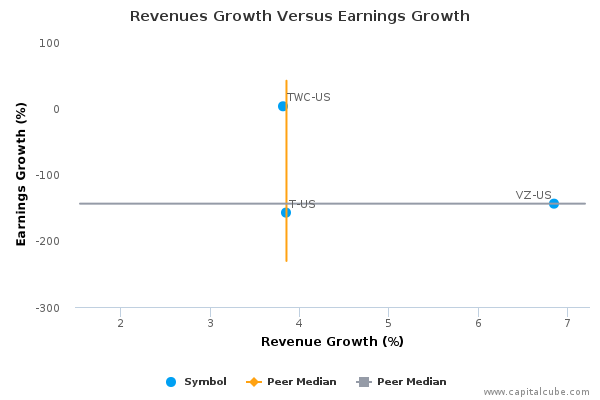
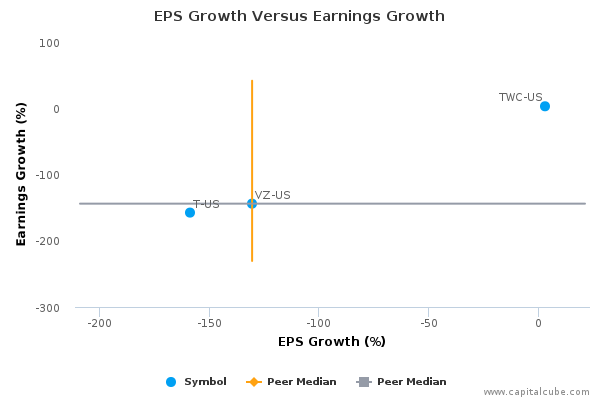
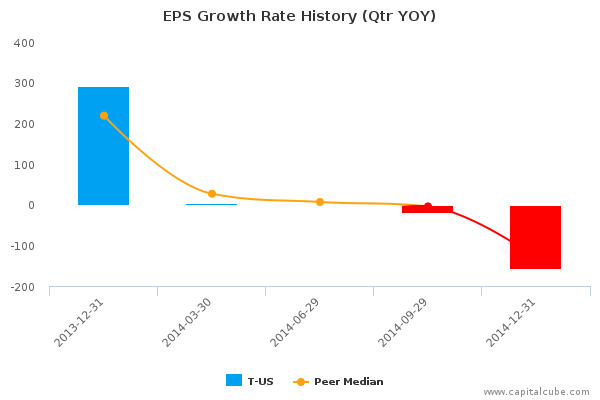
Compared to the same period last year, T-US's change in revenue exceeded its change in earnings, which was -157.53%. This suggests perhaps that the company's focus is on market share at the expense of profitability. But more important, this revenue performance is among the lowest thus far in its sector–inviting the potential for current and future loss of market share. Also, for comparison purposes, revenues changed by 4.50% and earnings by -232.48% compared to the quarter ending September 30, 2014.
Earnings Growth Analysis
The company's year-on-year decline in earnings was influenced by a weakening in gross margins from 63.10% to 46.17%, as well as issues with cost controls. As a result, operating margins (EBITDA margins) went fro 51.01% to 3.30% in this time frame. For comparison, gross margins were 55.88% and EBITDA margins were 30.16% in the quarter ending September 30, 2014.
Cash Versus Earnings – Sustainable Performance?
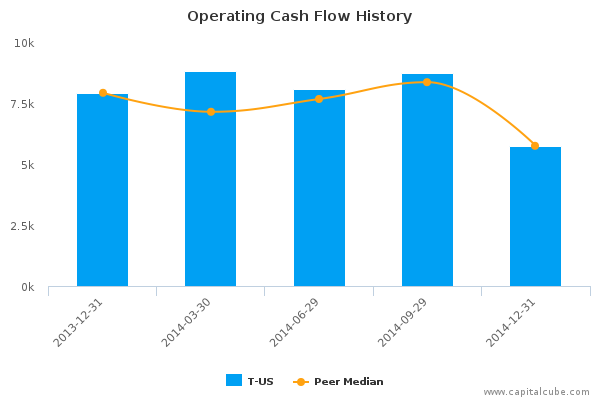
T-US's year-on-year change in operating cash flow of -27.43% is better than its change in earnings. This suggests that the company might have been able to declare a higher earnings number. But, this change in operating cash flow is lower than the average of the results announced to date by its peer group.
Margins
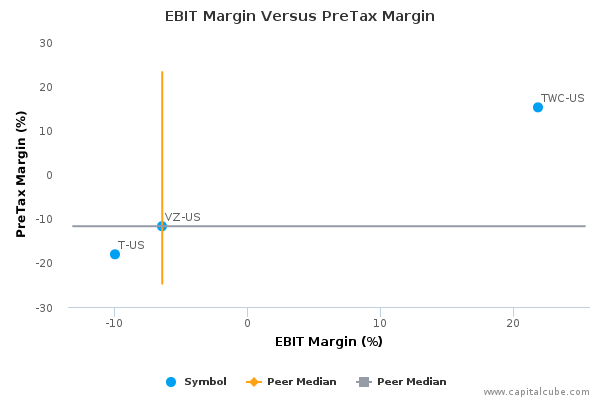
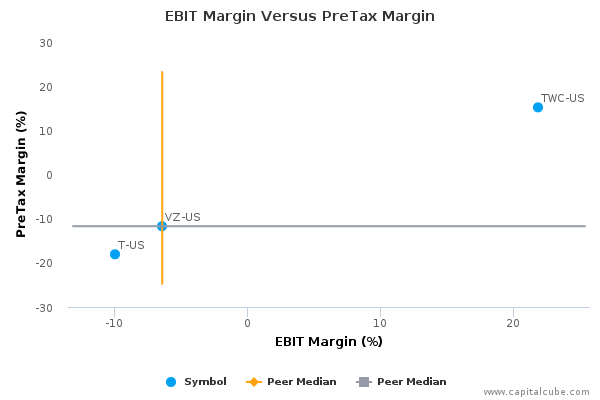
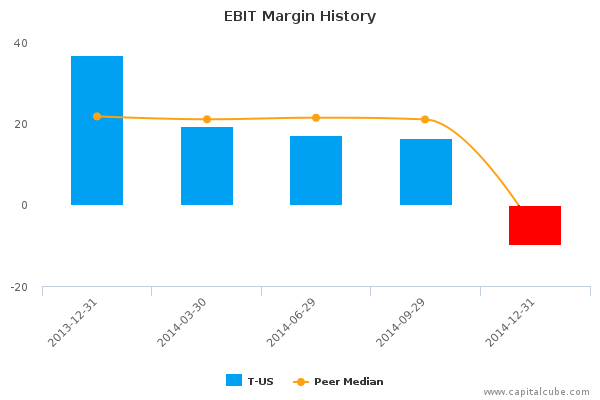
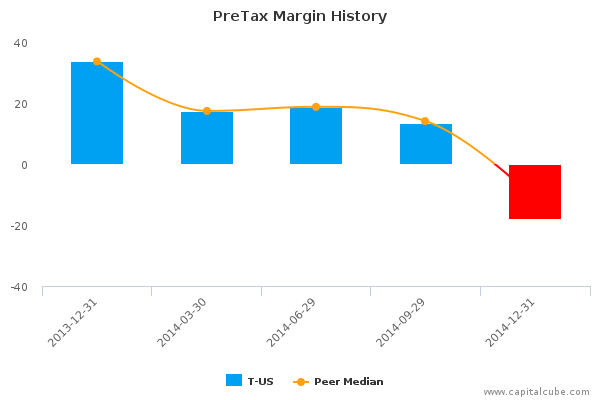
The company's decline in earnings has been influenced by the following factors: (1) Decline in operating margins (EBIT margins) from 36.90% to -9.96% and (2) one-time items that contributed to a decrease in pretax margins from 33.63% to -18.07%
EPS Growth Versus Earnings Growth
Company Profile
AT&T, Inc. provides telecommunication services and products, including wireless communications, local exchange services, long-distance services, data/broadband and Internet services, video services, telecommunications equipment, managed networking and wholesale services. It operates business through three reportable segments: Wireless, Wireline and Other. The Wireless segment operates comprehensive range of high-quality nationwide wireless voice and data communications services in a variety of pricing plans, including postpaid and prepaid service plans.
It also sells handsets, wirelessly enabled computers and personal computer wireless data cards manufactured by various suppliers for use with voice and data services. The Wireline segment provides both retail and wholesale communication services domestically and internationally. Its wireline services into three product-based categories: voice, data and other. The Other segment includes equipment, outsourcing, government-related services, customer information services and satellite video services. The security service includes business continuity and disaster recovery services as well as premise and network based security products. The company was founded in 1876 and is headquartered in Dallas, TX.
