ASX200 Mean Reversion Could (Finally) Be Underway

Published 10/02/2019, 11:32 AM
Updated 08/22/2024, 06:01 PM
AXJO
-
S&P/ASX 200

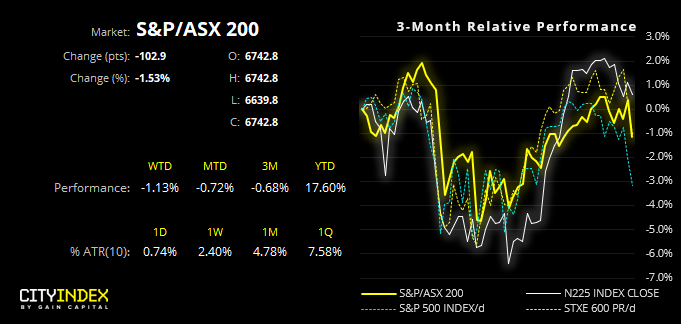
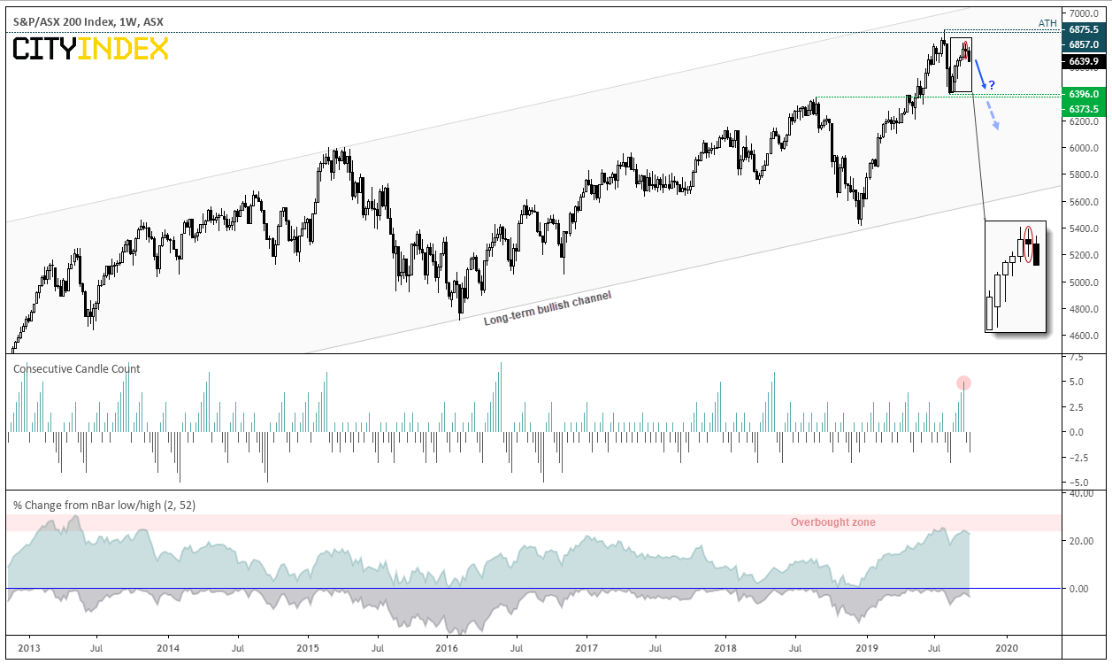
We’ve been monitoring the potential for an inflection point on the S&P/ASX 200 for the past couple of weeks and it appears cracks are now appearing at recent highs. There’s no denying it remains within a long-term uptrend trend on the weekly chart, as it trades within an established bullish channel. Yet this channel allows for some large swings, and a lower high in September is just one clue that the downside beckons.
Weekly S&P/ASX 200

The lower indicator measures the % distance from its 52-week high or low. Historically, rallies around 25-30% from the 52-week low have triggered a sizable correction, a threshold, which was achieved at this year’s high. Furthermore, five bullish weeks were seen ahead of a spinning top doji and, itself a candidate for a swing high. As price action has now breached the doji low, it further suggests a top is in on the weekly chart.
Daily S&P/ASX 200

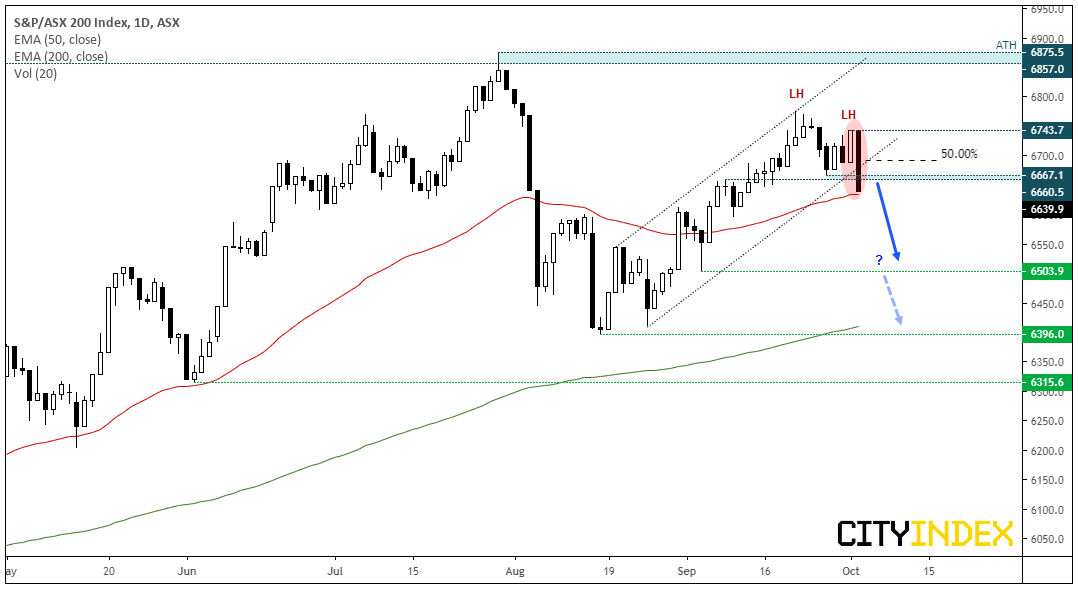
Switching to the daily chart has seen a bearish break of a bullish channel. And not only was this bearish outside day its worst session in 7-weeks, but it opened at the high and closed at the low to produce a bearish Marabuzo candle. One method to use such elongated candles is to simply measure the 50% of its range to use as an invalidation point if it is crossed. And yesterday’s candle has also formed a lower high ahead of the breakout.

  • Whilst prices closed beneath 6,660 support, the 50-day average is providing support for now.
  • Given the bearish clues overall, we remain bearish on the daily chart below 6743.7. However, the 50% Marabuzo line can be used to invalidate the bias, if a more aggressive approach is preferred.
  • A break beneath the 50-day eMA could suggest the downside is to continue, and bears could target the base of the channel just above the 6,400 and use 6,500 as an interim target.
  • Due to the mean reversion potential of the weekly chart, we’ll continue to monitor its potential for a much larger breakdown as price action unfolds.

Latest comments

Loading next article…
Risk Disclosure: Trading in financial instruments and/or cryptocurrencies involves high risks including the risk of losing some, or all, of your investment amount, and may not be suitable for all investors. Prices of cryptocurrencies are extremely volatile and may be affected by external factors such as financial, regulatory or political events. Trading on margin increases the financial risks.
Before deciding to trade in financial instrument or cryptocurrencies you should be fully informed of the risks and costs associated with trading the financial markets, carefully consider your investment objectives, level of experience, and risk appetite, and seek professional advice where needed.
Fusion Media would like to remind you that the data contained in this website is not necessarily real-time nor accurate. The data and prices on the website are not necessarily provided by any market or exchange, but may be provided by market makers, and so prices may not be accurate and may differ from the actual price at any given market, meaning prices are indicative and not appropriate for trading purposes. Fusion Media and any provider of the data contained in this website will not accept liability for any loss or damage as a result of your trading, or your reliance on the information contained within this website.
It is prohibited to use, store, reproduce, display, modify, transmit or distribute the data contained in this website without the explicit prior written permission of Fusion Media and/or the data provider. All intellectual property rights are reserved by the providers and/or the exchange providing the data contained in this website.
Fusion Media may be compensated by the advertisers that appear on the website, based on your interaction with the advertisements or advertisers.
© 2007-2025 - Fusion Media Limited. All Rights Reserved.