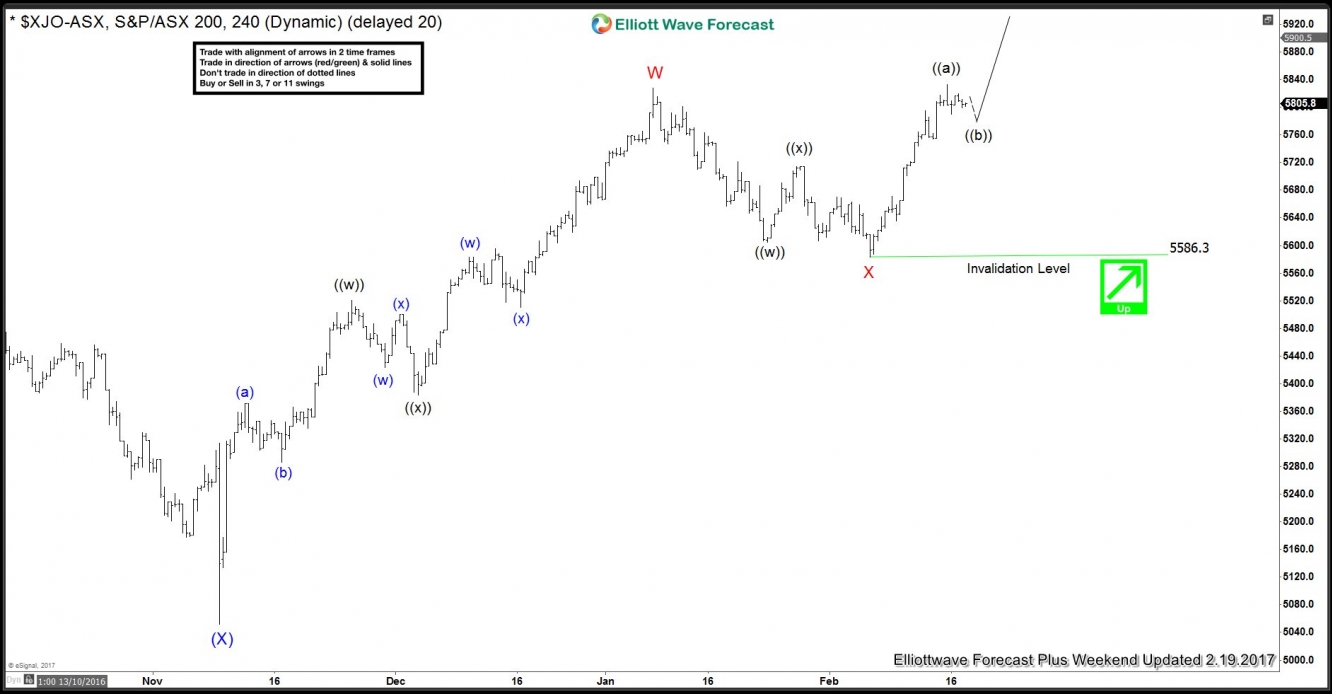
In this Technical blog we are going to take a quick look at ASX All Ordinaries from Australia cycle from February 2017 lows, here’s the short review of previous blog from February 1, in which the index was showing 5 swings corrective sequence from January 09,2017 peak and we were looking for 1 more leg lower at our blue box buying area. But then index broke the 1 hour invalidation level and truncated the last leg lower. Since then index has rallied significantly and broke to new highs above January 09,2017 peak, thus suggesting the pullback in wave X completed at 2/07 low (5583) and index has started the next leg higher already as shown below 4 hour 2/19 weekend updated chart. Now while above that level, Index has scope to resume higher to complete the larger cycle from February 2016 lows.
ASX 4 Hour chart 
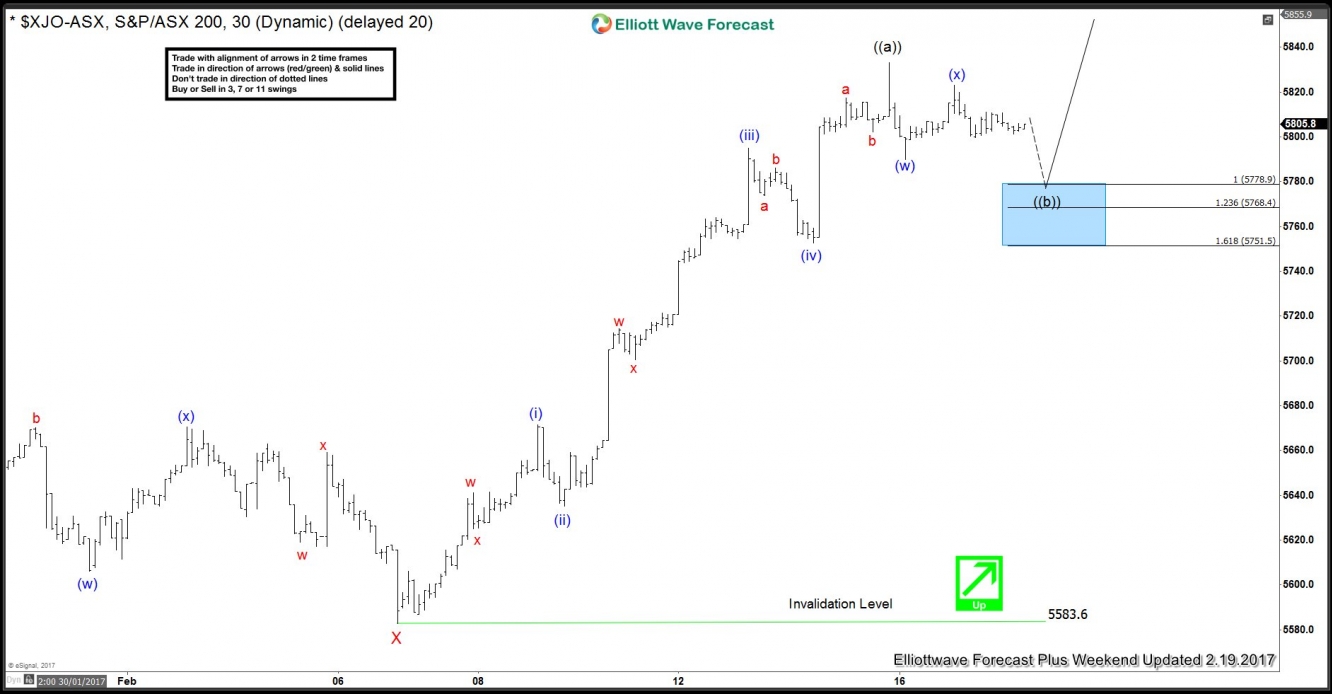
The cycle from 2/07 low (5583) is appeared to be in 5 waves impulsive sequence, in which Elliott wave theory suggest after 5 waves (impulsive) move there should be 3 waves pullback then another 5 waves moves should happen into the direction of first leg also known as (5,3,5) A,B,C structure. Hence the 5 waves up from 5583 low has ended the first leg higher labelled as wave ((a)) at 5831 peak. Below from there index has already started the 3 waves pullback in wave ((b)) and we expect buyers to appear in the dips in 3, 7 or 11 swings as far as pivot from 2/07 low (5583) low remains intact. And within the current pullback 5778-5751 blue box area is expected to end the wave ((b)) pullback in the index or alternatively could finish the first leg of a current pullback. Also it is important to note that since the weekend update we have already hit the 5778 low and there were buyer’s as expected.
ASX 1 Hour chart
