My previous article discussed the technicals behind a possible large move in silver over the coming days and weeks. Silver isn’t the only asset I am watching right now, as I expect volatility to pick up. Here are another three interesting charts for you traders out there:
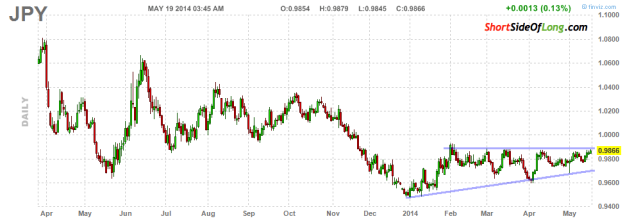
Chart 1: Yen has been dead quiet as of late, so watch for a large move…
Source: Fin Viz (edited by Short Side of Long)
- The Japanese yen was the worst performing currency last year, with volatility sky high. However, since the Fed announced its taper plans, the yen has been basing, while its volatility has completely died down (Bollinger® bands are super compressed).
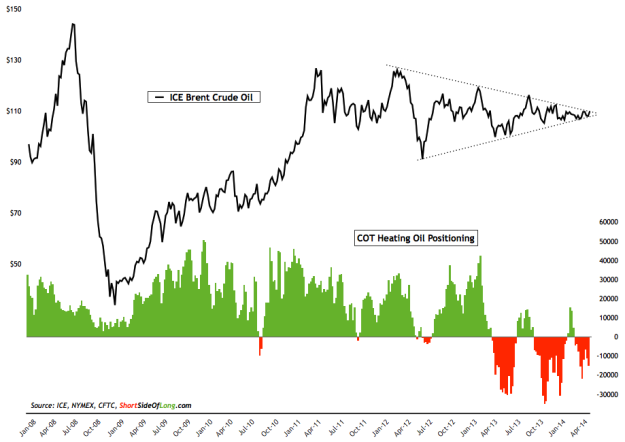
Chart 2: Oil has been indecisive for 3 years and now it's decision time
Source: Short Side of Long
- Brent Crude Oil peaked during the Libyan Crisis in the middle of 2011 and has not made any progress since. The downside has been limited to about $90 while the upside has gone as high as about $120. This range has narrowed in recent quarters, as the price consolidates in a technical triangle. As of this week, there is really no running away any more – its decision time for Crude!
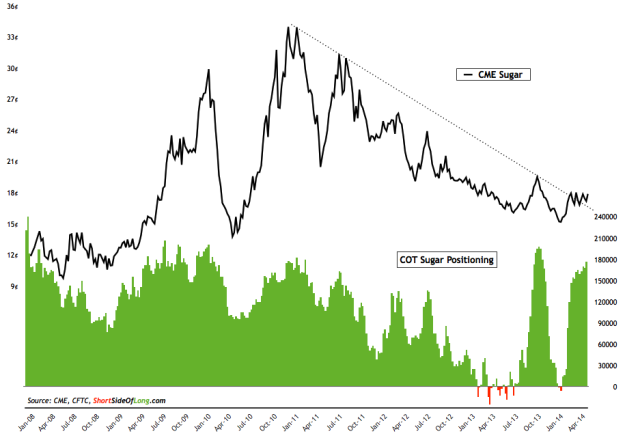
Chart 3: Sugar is attempting to break out of a three year bear market
Source: Short Side of Long
- Sugar is attempting to break out of its prolonged bear market, after being down three years in the row. Already down over 50% in the last three years and without a positive annualised performance for over two years, Sugar is trying to surprise the bears. However, it is always a worry when one seeings such huge contracts built up on the long side. It is as if everyone is expecting Sugar to break out… careful here!


