
If there’s reason to worry about the global economy, it’s not obvious in asset prices these days. Positive momentum seems to have the upper hand, at least for the moment. The winners keep winning and the losers are trimming their losses.
October may have a dark history for markets, but you wouldn’t know it from looking at trading activity in recent weeks. There’s a clear bias to the upside of late. Leading the charge higher among the major asset classes (still) is our ETF proxy for US stocks—the Vanguard Total Stock Market ETF (VTI), which is higher so far this year by nearly 27%. On the opposite end are commodities, based on the iPath DJ-UBS Commodity (DJP), which is lower this year by 9%.
For another perspective, consider the relative changes in the asset allocation of an equal-weighted portfolio of all the major asset classes this year. The chart below depicts the current portfolio composition (based on proxy ETFs) in context with the range of allocations year to date, based on a start date of Dec. 31, 2012 for the equal weights. The strategy for this illustration is equally weighting everything and letting the unmanaged allocations fluctuate freely through yesterday’s closing prices on October 22.
Turning to a review of how the individual markets have performed, the next chart shows the year-to-date results in relative terms through October 22 with all the ETF prices rebased to 100 as of Dec. 31, 2012:
Next, here’s how an ETF-based version of a passive, market-value-weighted mix of all the major asset classes stacks up so far in 2013—the Global Market Index Fund, or GMI.F. This investable strategy benchmark is higher by nearly 12%, or roughly midway between the year-to-date returns for US stocks and bonds.
In addition, consider how the Rebalancing Opportunity Index (ROI) for GMI.F has evolved. This benchmark, which uses the dispersion of returns as a measure of the fluctuating potential for enhancing return, lowering risk, or both via rebalancing, is currently just above a neutral reading. In other words, the potential for adding value with rebalancing looks relatively low compared with the 150-plus levels in May 2013. (Note: ROI's calculation in the chart below is based on rolling 1-year returns for each of the 14 ETF components in GMI.F--the "standard" view on these pages. Adjusting the historical window to reflect alternative time horizons and/or the asset mix will dispense different ROI values. For a brief overview of ROI, see this post.)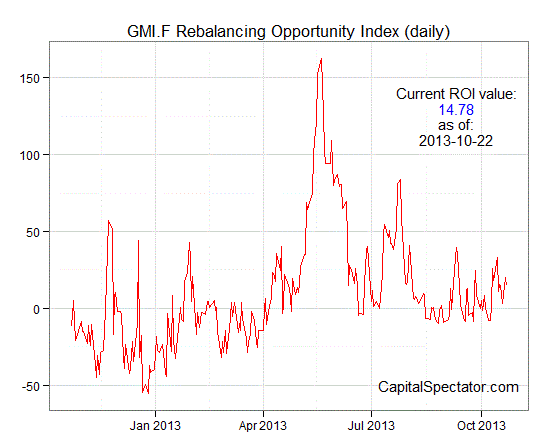
For a deeper look at an ETF-based view of asset classes, consider the weekly updates via The ETF Asset Class Performance Review.
- English (UK)
- English (India)
- English (Canada)
- English (Australia)
- English (South Africa)
- English (Philippines)
- English (Nigeria)
- Deutsch
- Español (España)
- Español (México)
- Français
- Italiano
- Nederlands
- Português (Portugal)
- Polski
- Português (Brasil)
- Русский
- Türkçe
- العربية
- Ελληνικά
- Svenska
- Suomi
- עברית
- 日本語
- 한국어
- 简体中文
- 繁體中文
- Bahasa Indonesia
- Bahasa Melayu
- ไทย
- Tiếng Việt
- हिंदी
Asset Allocation Review: Positive Momentum Continues
Published 10/23/2013, 07:28 AM
Updated 07/09/2023, 06:31 AM
Asset Allocation Review: Positive Momentum Continues
Latest comments
Loading next article…
Install Our App
Risk Disclosure: Trading in financial instruments and/or cryptocurrencies involves high risks including the risk of losing some, or all, of your investment amount, and may not be suitable for all investors. Prices of cryptocurrencies are extremely volatile and may be affected by external factors such as financial, regulatory or political events. Trading on margin increases the financial risks.
Before deciding to trade in financial instrument or cryptocurrencies you should be fully informed of the risks and costs associated with trading the financial markets, carefully consider your investment objectives, level of experience, and risk appetite, and seek professional advice where needed.
Fusion Media would like to remind you that the data contained in this website is not necessarily real-time nor accurate. The data and prices on the website are not necessarily provided by any market or exchange, but may be provided by market makers, and so prices may not be accurate and may differ from the actual price at any given market, meaning prices are indicative and not appropriate for trading purposes. Fusion Media and any provider of the data contained in this website will not accept liability for any loss or damage as a result of your trading, or your reliance on the information contained within this website.
It is prohibited to use, store, reproduce, display, modify, transmit or distribute the data contained in this website without the explicit prior written permission of Fusion Media and/or the data provider. All intellectual property rights are reserved by the providers and/or the exchange providing the data contained in this website.
Fusion Media may be compensated by the advertisers that appear on the website, based on your interaction with the advertisements or advertisers.
© 2007-2025 - Fusion Media Limited. All Rights Reserved.