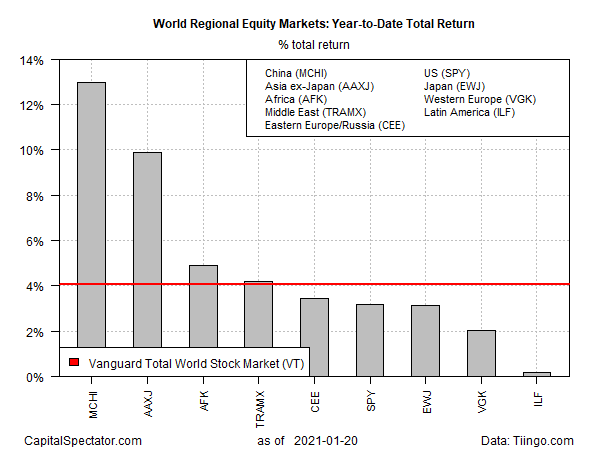
It’s too early in the new year to draw conclusions, but the initial results for 2021 look promising for equity markets in Asia outside of Japan, based on set of exchange-listed funds that represent the world’s main equity regions through Jan. 20.
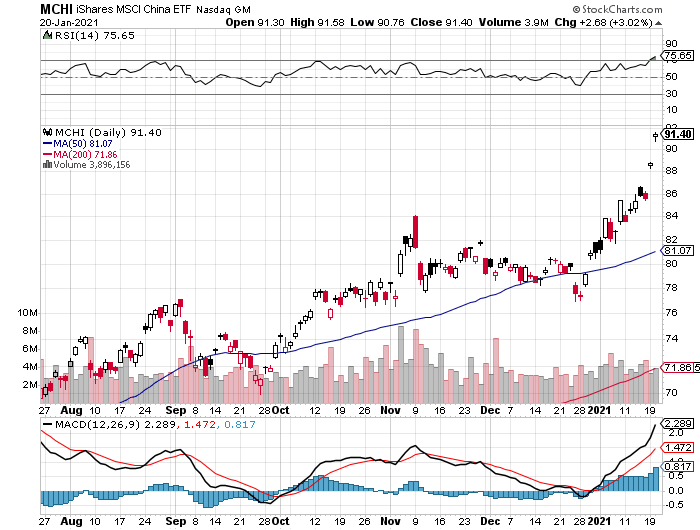
Shares in China are well ahead of the rest of the field so far this year. The iShares MSCI China ETF (NASDAQ:MCHI) (MCHI) has surged 12.9% through yesterday’s close. Notably, the fund has gapped up sharply over the last two days.
Asia stocks outside of Japan overall are having a strong start to the year, too, based on iShares MSCI All Country Asia ex Japan ETF (NASDAQ:AAXJ). This fund, which holds a broad mix of stocks in the region outside of Japan, is up 10.0% so far this year – a solid second-place performance.
In fact, all the major equity regions are enjoying year-to-date gains, although results vary widely. US shares are up a relatively modest 2.7% via SPDR S&P 500 (NYSE:SPY). The weakest regional year-to-date performer: iShares Latin America 40 ETF (NYSE:ILF), which is posting a tepid 0.7% gain.
The global equity benchmark, Vanguard Total World Stocks (VT), is a competitive performer so far in 2021 with a 4.0% gain.
Asia’s edge so far this year may be indicative of the months ahead for the region, but for another perspective let’s compare how global stocks have fared since last year’s low point in the coronavirus crash, defined as the trough for U.S. stocks (Mar. 23, 2020). Based on that starting date, Asia ex-Japan remains a top performer, but the strongest bounce is found in Africa.
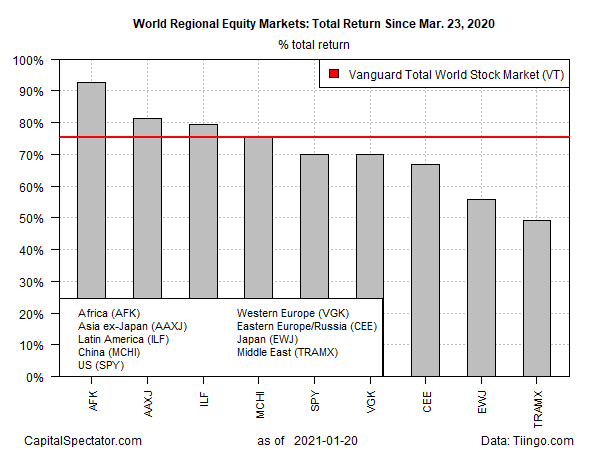
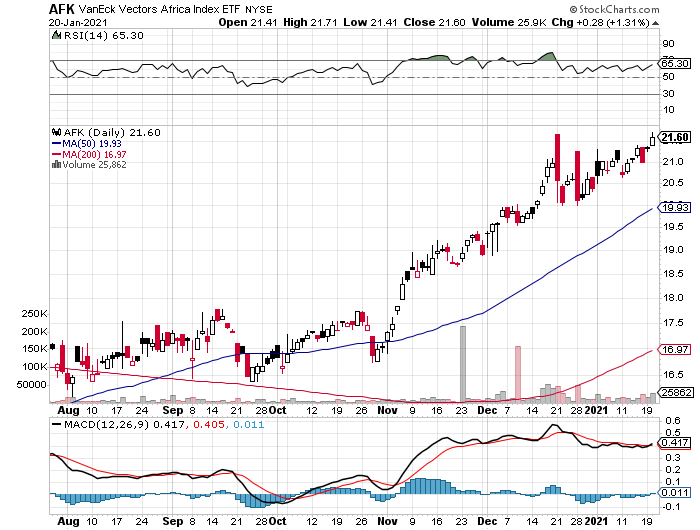
After languishing in 2019, VanEck Vectors Africa (AFK) was hit hard during the coronavirus selloff last spring. But the fund has been on a tear in recent months and is currently the top performer since the March 23, 2020, bottom, posting a gain of more than 90% over that period.
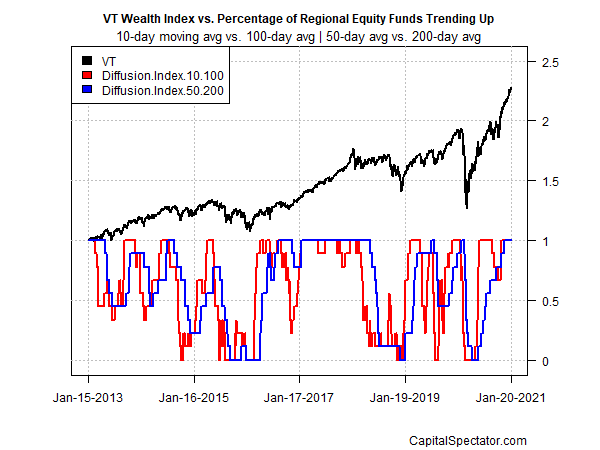
In fact, bullish momentum overall is widespread for the ETFs listed above, based on measuring returns through a short-term momentum lens, based on the 10-day vs. 100-day moving averages (red line in chart below). Medium-term momentum (50- vs. 100-day averages) is also sizzling on all fronts. Trending behavior is cyclical, of course, as the chart below reminds. For the moment, however, these are the best of times for the bulls as all corners of global equities run hot.
