International stocks have made a big run through the first half of 2017 and one region that’s spearheading the charge is Asia. Countries like Japan, India, South Korea, and Taiwan continue to exhibit dominant momentum driven by a combination of technical and fundamental factors. The depreciation of the U.S. dollar versus regional foreign currencies is one of the more prominent stories driving this thrust, in addition to favorable corporate growth forecasts.
An excellent market capitalization weighted benchmark for tracking the Pacific Rim is the Vanguard FTSE Pacific ETF (NYSE:VPL). This low-cost index fund has exposure to over 2,200 securities spread throughout the Asia region. VPL has $3.9 billion in assets under management and charges an expense ratio of just 0.10% to access its highly diversified portfolio.
Top holdings in VPL include well-known names such as Samsung Electronics (KS:005930) and Toyota Motor Corporation (NYSE:TM). The country allocations include nearly 60% exposure to Japan followed by Australia, Korea, and Hong Kong. The portfolio contains a clear emphasis on developed markets in this corner of the globe.
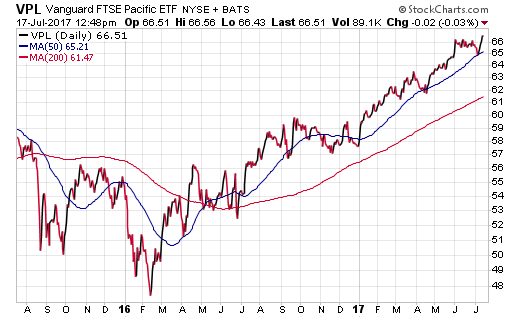
The 2-year chart below demonstrates this fund bottomed in early 2016 in conjunction with the majority of global stock market indices and has been on a tremendous run ever since. VPL just recently hit new all-time highs and has managed to stay about its key trend lines for much of the last year. These signs point towards a healthy uptrend with little indication of slowing.

Investors who may be concerned about the over concentration of Japanese stocks based on market capitalization rankings have alternative ETF options available as well. The iShares MSCI All Country Asia ex Japan ETF (NASDAQ:AAXJ) and iShares MSCI Pacific ex-Japan ETF (NYSE:EPP) are two of the more popular funds in this class.
AAXJ excludes Japan from its index selection criteria while simultaneously widening its scope to include emerging market nations. This puts a heightened emphasis China as the number one country allocation at 36%. Companies domiciled in South Korea, Taiwan, and India are also present in the top rankings of this fund. AAXJ contains 643 holdings, has $3.8 billion in assets, and charges an expense ratio of 0.72%.
By contrast, EPP continues along the avenue of developed market exposure by significantly overweighting Australia at 59% of its portfolio allocation. Hong Kong, Singapore, and New Zealand make up the remainder of the concentrated 150 stock portfolio. This ETF take a more focused approach to a smaller subset of countries and may be more applicable for those seeking targeted international equity exposure.
Lastly, the growth of emerging markets continues to be a popular theme among ETF fund flows this year. The iShares MSCI Emerging Markets Asia ETF (NASDAQ:EEMA) and SPDR S&P Emerging Asia Pacific ETF (NYSE:GMF) are two ways to access this theme. Both funds target a wide selection of stocks throughout the Asia region through a passive index-based structure.
The Bottom Line
The use of regional international ETFs can allow investors the capability to supplement core foreign stock exposure or overweight a specific corner of the globe. These funds allow investors the capability to focus on certain themes or currency trends without the single country risk that comes with trying to pick an individual nation’s stock market growth.
Keep in mind that many of the ETFs in this category offer widely varying index construction methodologies and costs. Investors considering these funds should closely compare the holdings and makeup closely to ensure they meet their individual objectives.
The views and opinions expressed herein are the views and opinions of the author and do not necessarily reflect those of Nasdaq, Inc.
Disclosure : FMD Capital Management, its executives, and/or its clients June hold positions in the ETFs, mutual funds or any investment asset mentioned in this article. The commentary does not constitute individualized investment advice. The opinions offered herein are not personalized recommendations to buy, sell or hold securities.
