Earnings season has begun and many investors are wondering if the wobbly price action seen in broad markets over the past few days could well continue in the near future.
Many stocks and indices have recently hit record highs. So, it would not be surprising if short-term profit-taking hits some of the darlings of Wall Street. Put another way, most of the good news regarding the upcoming earnings season could already be priced into the markets.
It may well be time to sell the news as stocks could become vulnerable in the coming days. Therefore, bond exchange-traded funds (ETFs) might be of interest to market participants wanting to diversify their portfolios and be a bit defensive.
What Are Bond ETFs?
Bond ETFs are baskets of bonds that trade on an exchange, making such funds liquid and easier to trade. A bond ETF may hold different types of fixed-income securities, including Treasuries, municipal bonds, corporate bonds, junk bonds or sovereign bonds. Bonds may also be part of a fund with a hybrid structure, meaning the ETF holds bonds as well as equities and other asset classes (such as REITs or commodities).
Bonds generally have a low correlation to equities (as a statistical measure, correlation shows how two investments have historically moved in relation to each other).

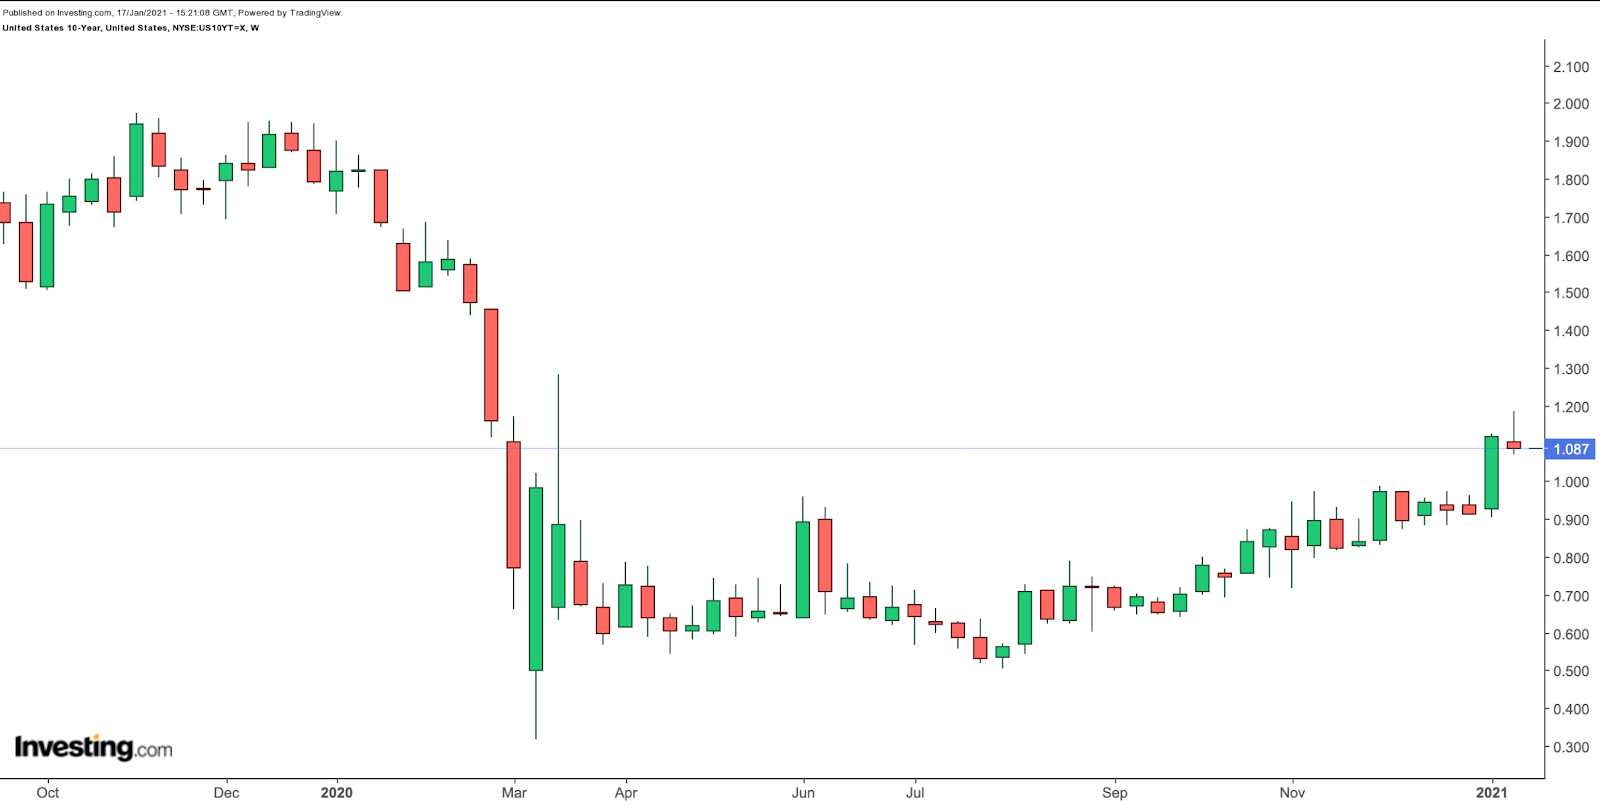
Many investors also rely on bonds for income. In early January, the US 10-year Treasury yield saw its highest level since late March 2020 and moved above 1%. US government bonds hit their lowest point since the start of the pandemic about a year ago.
By comparison, in January 2017, when President Trump started his tenure, the yield was around 2.5. Most readers would know that yields on 10-year Treasury notes are inversely related to prices.
Now analysts debate where the rate could go from here. Despite the uncertainty regarding yields, we believe bond ETFs could find a moderate place in portfolios and complement core equity holdings.
Meanwhile, the credit risk that comes with corporate bonds also means higher yields than those offered by government bonds. Thus, those who also invest in corporate bonds typically achieve higher yields.
We should note that most individual bonds make payments semiannually or twice each year. On the other hand, bond ETFs typically pay interest monthly, a feature that makes them attractive to regular income-seeking investors.
Investors who are not sure how much of their portfolio to allocate to different types of bonds may want to talk to a financial advisor.
With that, here are two ETFs that could appeal to investors seeking higher yields.
1. Fidelity Total Bond ETF
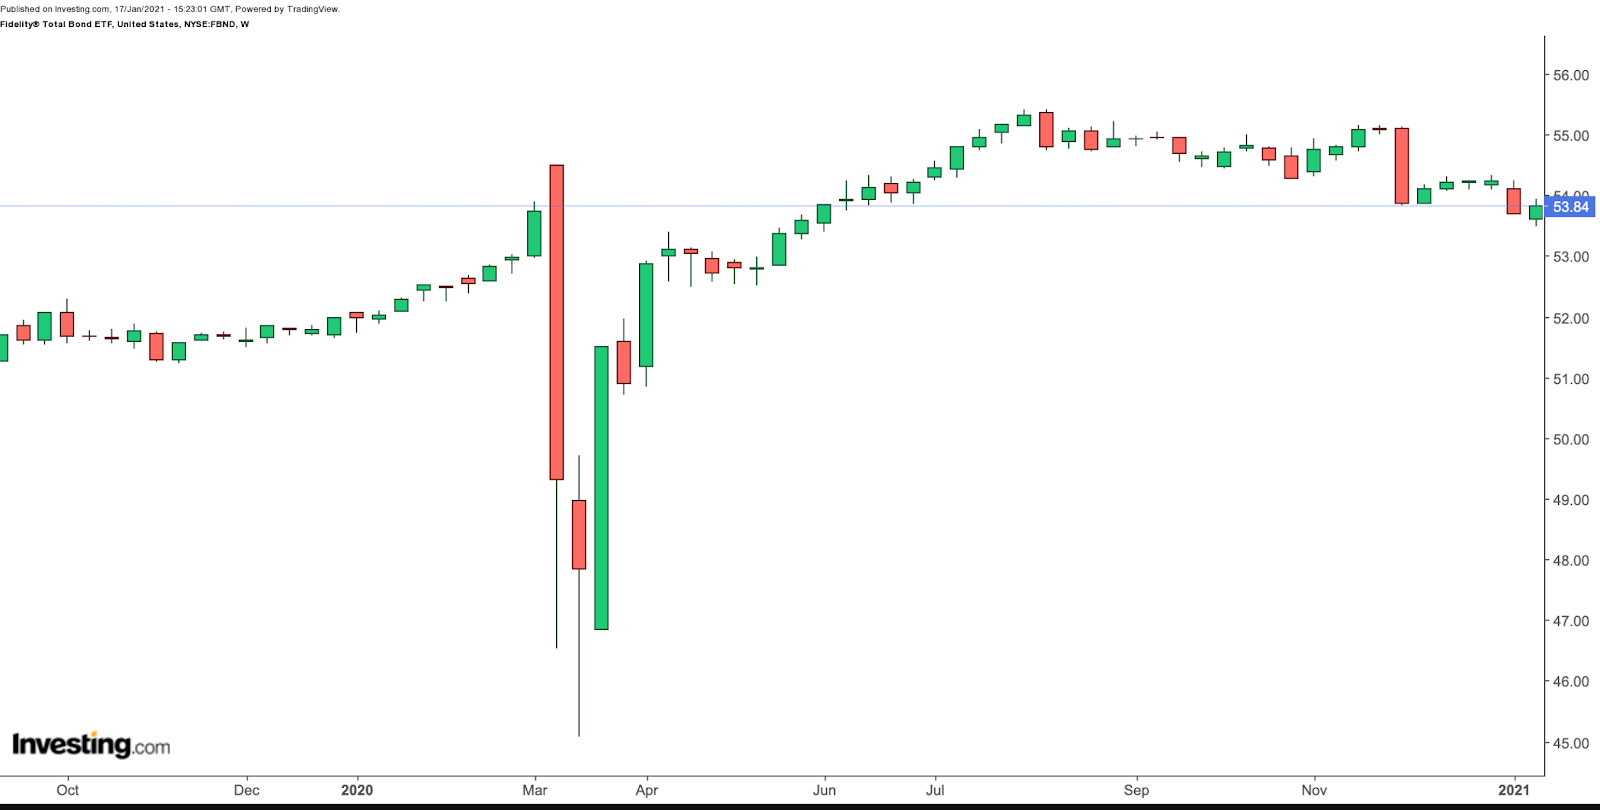
- Current price: $53.84
- 52-Week Range: $45.08 - $55.41
- Yield (TTM-Trailing Twelve Month): 2.30%
- Expense Ratio: 0.36%
The Fidelity® Total Bond ETF (NYSE:FBND) offers diversification in the fixed income space and aims to offer current income. It covers government, mortgage, investment-grade corporate and junk bonds. About 87% of the holdings come from the US.
FBND, which tracks the Bloomberg Barclays (LON:BARC) Barclays Aggregate Bond Index, has 1451 holdings. Since its inception in October 2014, assets under management have reached $1.7 billion.
Over the past year, the ETF has returned about 3.5%. We believe a large number of investors could allocate some of their funds in a liquid fund like FBND and collect regular returns. In the case of a potential decline in equity prices, they could also use some of their allocations in FBND to invest in securities at lower prices, especially after the earnings season.
2.iShares Morningstar Multi-Asset Income ETF
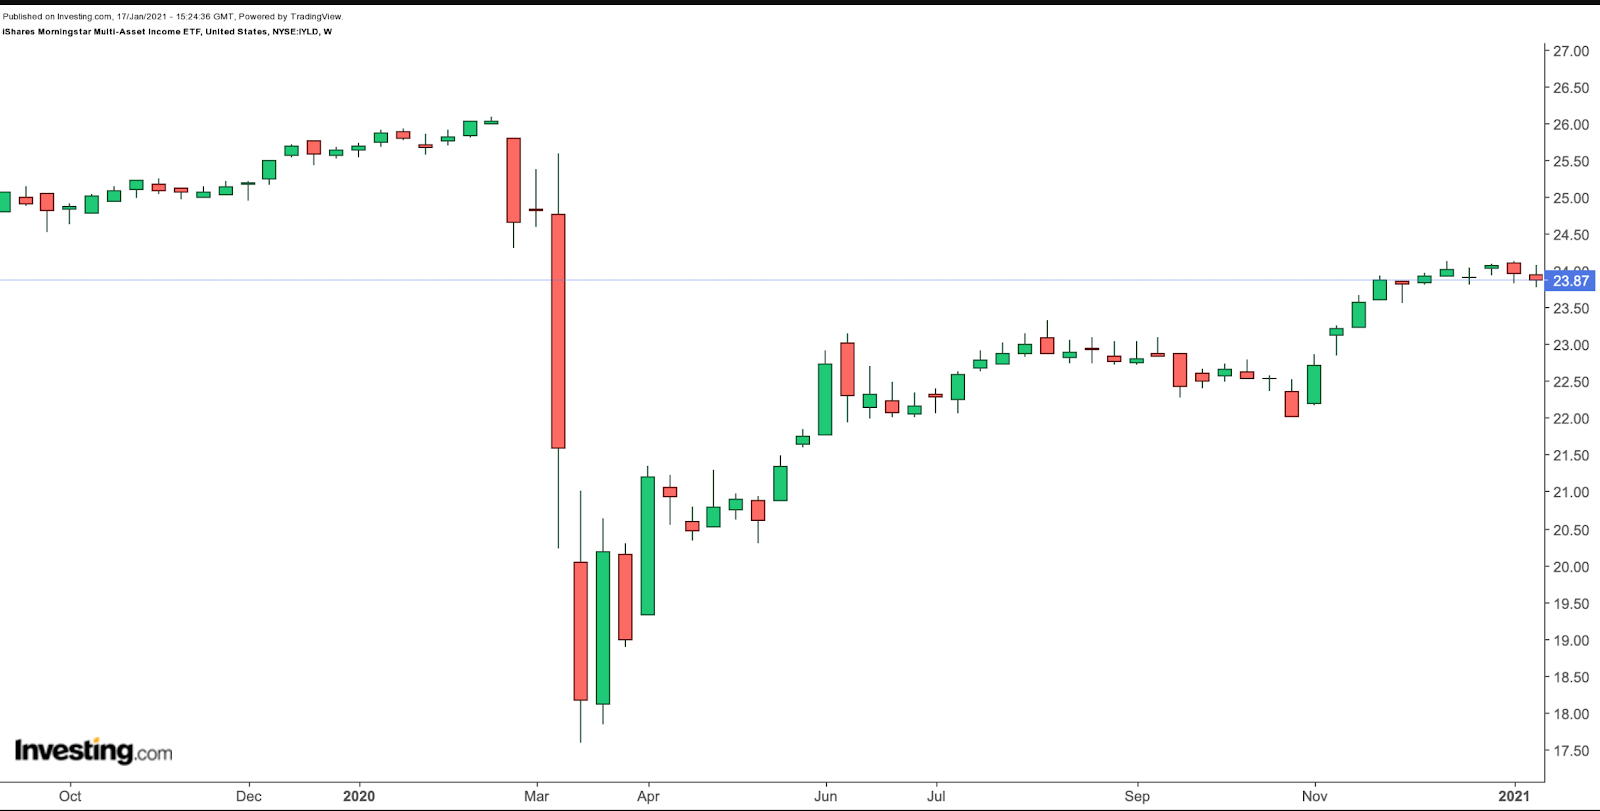
- Current price: $23.87
- 52-week range: $17.59 - $26.08
- Yield (TTM-Trailing Twelve Month): 4.39%
- Expense ratio: 0.60%
The iShares Morningstar Multi-Asset Income ETF (NYSE:IYLD) gives access to different assets, including bonds (60%), equities (20%) and alternative income sources (20%). Fund managers aim to achieve high current income as well as some capital appreciation.
IYLD, which tracks the Morningstar Multi-Asset High Income Index, started trading in 2012. With ten holdings, its net assets are over $265 million.
A detailed study of the fund will show an investment in other BlackRock ETFs, with a greater focus on fixed-income funds. The top five names in IYLD make up close to 80% of the ETF. They include:
- iShares iBoxx High Yield Corporate Bond ETF (NYSE:HYG)
- iShares International Select Dividend ETF (NYSE:IDV)
- iShares Preferred and Income Securities ETF (NASDAQ:PFF)
- iShares 10-20 Year Treasury Bond ETF (NYSE:TLH)
- iShares 20+ Year Treasury Bond ETF (NASDAQ:TLT)
IYLD primarily provides exposure to non-US equities (as opposed to US securities) as dividend income in non-US equities tends to be higher than those offered by US stocks.
Over the past 52-weeks, IYLD is down about 7.7%. Its composition could make it appropriate for passive income seekers, such as retirees. Its current yield stands at 4.39%.
