The Toro Company (NYSE:) delivered fourth-quarter fiscal 2017 (ended Oct 31, 2017) earnings of 31 cents per share, up 15% from 27 cents recorded in the year-ago quarter. Additionally, earnings comfortably beat the Zacks Consensus Estimate of 27 cents.
Toro’s net sales were up 4.3% year over year to $488.6 million in the quarter. The top line also beat the Zacks Consensus Estimate of $474 million.
Operational Update
Cost of sales in the quarter went up 2.8% year over year to $304.4 million. Gross profit came in at $184.3 million, up 7% year over year. Gross margin improved 90 basis points (bps) year over year to 37.7%, primarily supported by favorable operational productivity and foreign currency exchange rates, partially offset by higher commodity costs.
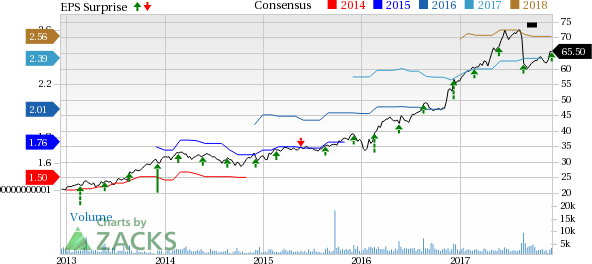
Toro Company (The) Price, Consensus and EPS Surprise

Toro Company (The) Price, Consensus and EPS Surprise | Toro Company (The) Quote
Selling, general and administrative expenses were up 6% to $137 million. Operating profit improved 9% year over year to $47.5 million. Operating margin came in at 9.7%, expanding 40 bps year over year.
Segment Performance
The Professional segment’s sales increased 5% year over year to $360 million. The upswing was driven by the success of newly introduced products in the landscape contractor businesses along with higher sales in golf and specialty construction markets. Operating profit recorded by the segment was $65 million, up 9% from $59.7 million recorded in the year-ago quarter.
Net sales at the Residential segment improved 3.2 year over year to $123 million. The segment benefited from the ongoing momentum in the international business along with increased sales of the Pope product line in Australia. Operating profit at the segment was $11.7 million, up 28% year over year.
Financial Update
Toro had cash and cash equivalents of $310 million at the end of the fiscal 2017 compared with $274 million at the end of prior fiscal. The company generated cash flow from operations of $360.7 million in fiscal 2017, compared with $384 million in the prior fiscal.
Long-term debt, excluding the current portion, was $305 million as of Oct 31, 2017, compared with $328 million as of Oct 31, 2016.
Toro’s board of directors declared a quarterly cash dividend of $0.20 per share, marking a hike of 14.3% from previous quarterly dividend. This dividend is payable on Jan 10, 2018, to shareholders of record on Dec 22, 2017.
For fiscal 2017, Toro returned around $236 million to shareholders through the payment of approximately $75.8 million in dividends and the repurchase of approximately 2.7 million shares of common stock.
Outlook
For fiscal 2018, Toro expects revenue growth to more than 4% and earnings per share in the range of $2.57-$2.63. For first-quarter fiscal 2018, the company guides net earnings to be about 42-44 cents per share.
Fiscal 2017 marked a record year for the company. New and innovative product offerings drove solid sales growth. Strong performance in golf, landscape contractor and rental businesses came on the back of successful new products such as the Exmark Radius zero-turn riding mowers, the Greensmaster series of greens mowers and the Dingo TX 1000 compact utility loader. The BOSS snow and ice management business also had a strong year driven by the continued success of the EXT extendable plows and the V-Box spreaders.
The company’s new initiative, Vision 2020, will help focus on driving profitable growth while emphasizing on innovation and serving customers.
Share Price Performance

In a year, shares of Toro have outperformed the industry which it belongs to. In fact, Toro’s shares have gained 15.8%, while the industry grew around 3.8%.
Toro currently carries a Zacks Rank #3 (Hold).
Some better-ranked stocks in the sector include Malibu Boats, Inc. (NASDAQ:) , MCBC Holdings, Inc. (NASDAQ:) and Polaris Industries Inc. (NYSE:) . All three stocks sport a Zacks Rank #1 (Strong Buy). You can see the complete list of today’s Zacks #1 Rank stocks here.
Malibu Boats has expected long-term growth rate of 15%. The stock has rallied 62.2% year to date.
MCBC Holdings has expected long-term growth rate of 15%. Year to date, the stock has gained 58.2%.
Polaris Industries has expected long-term growth rate of 15%. Its shares have gained 53.25% year to date.
Wall Street’s Next Amazon (NASDAQ:)
Zacks EVP Kevin Matras believes this familiar stock has only just begun its climb to become one of the greatest investments of all time. It’s a once-in-a-generation opportunity to invest in pure genius.
Click for details >>
Polaris Industries Inc. (PII): Free Stock Analysis ReportMCBC Holdings, Inc. (MCFT): Free Stock Analysis ReportMalibu Boats, Inc. (MBUU): Free Stock Analysis ReportToro Company (The) (TTC): Free Stock Analysis ReportOriginal postZacks Investment Research


