🤑 It doesn’t get more affordable. Grab this 60% OFF Black Friday offer before it disappears…CLAIM SALE

Why Gold Turned Bearish From $1306

Published 10/27/2017, 08:00 AM
Updated 07/09/2023, 06:31 AM
XAU/USD
-
GC
-

Gold’s last major bottom was formed at $1260.50 on October 6th, following a decline from as high as $1357. By October 16th, the price of the precious metal was up to $1306 for a recovery of over $45. But instead of continuing to the north, the bulls could not breach this barrier and fell pray to the bears, who dragged gold prices to as low as $1265 as of this writing. What happened at $1306 and why did the bulls abandon their ambitions so quickly?

Two trading weeks ago, before the market opened on Monday, October 16th, we sent 7 analyses to our premium subscribers, including one of gold. The following chart was included.
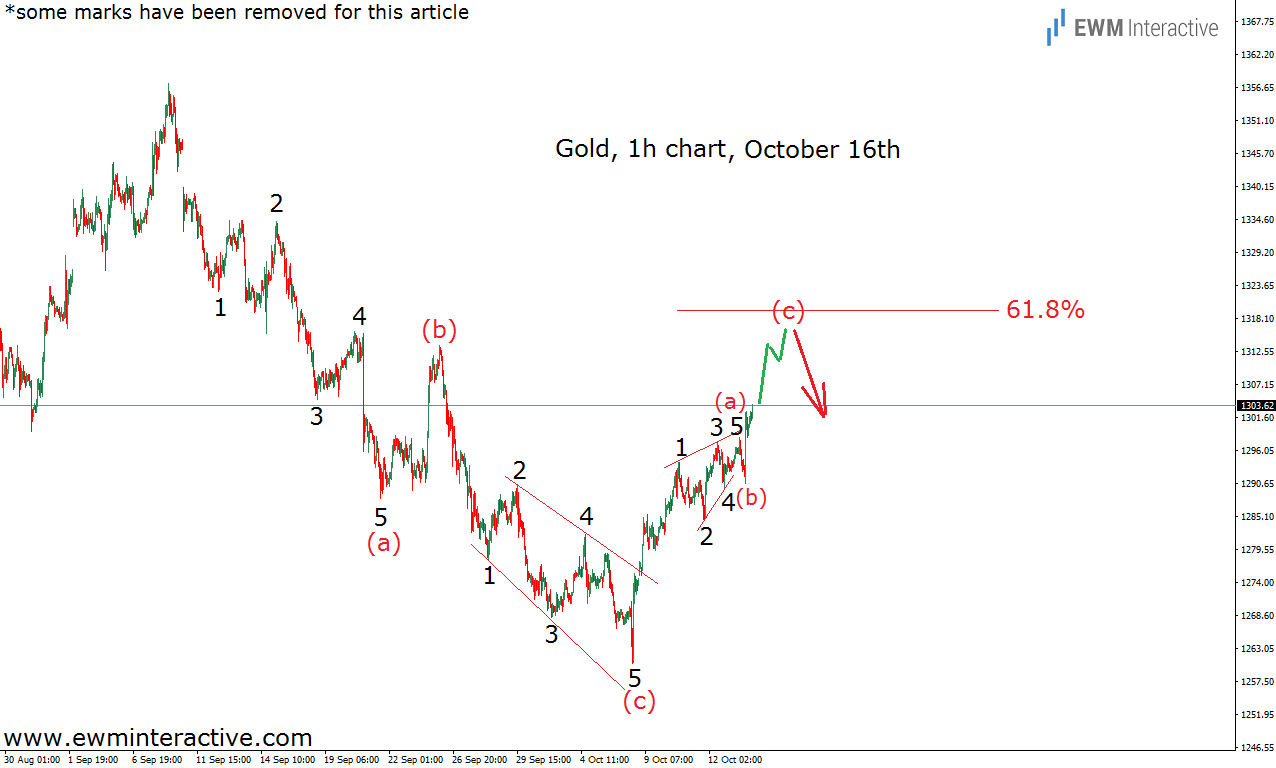
Gold 1 H Chart October 16th

As visible, the decline between $1357 and $1260 was a simple (a)-(b)-(c) zig-zag with a regular five-wave impulse in wave (a) and an expanding ending diagonal in wave (c). After we took a look at the bigger picture on the daily chart, we though the recovery from $1260 was also going to be limited to a three-wave sequence. Since three-wave patterns are counter-trend moves, it made sense to prepare for more weakness once the recovery was over. The 61.8% Fibonacci level looked like a reasonable area for the bearish reversal to take place, so we suspected gold should at least climb to $1310. The bears did not think so.
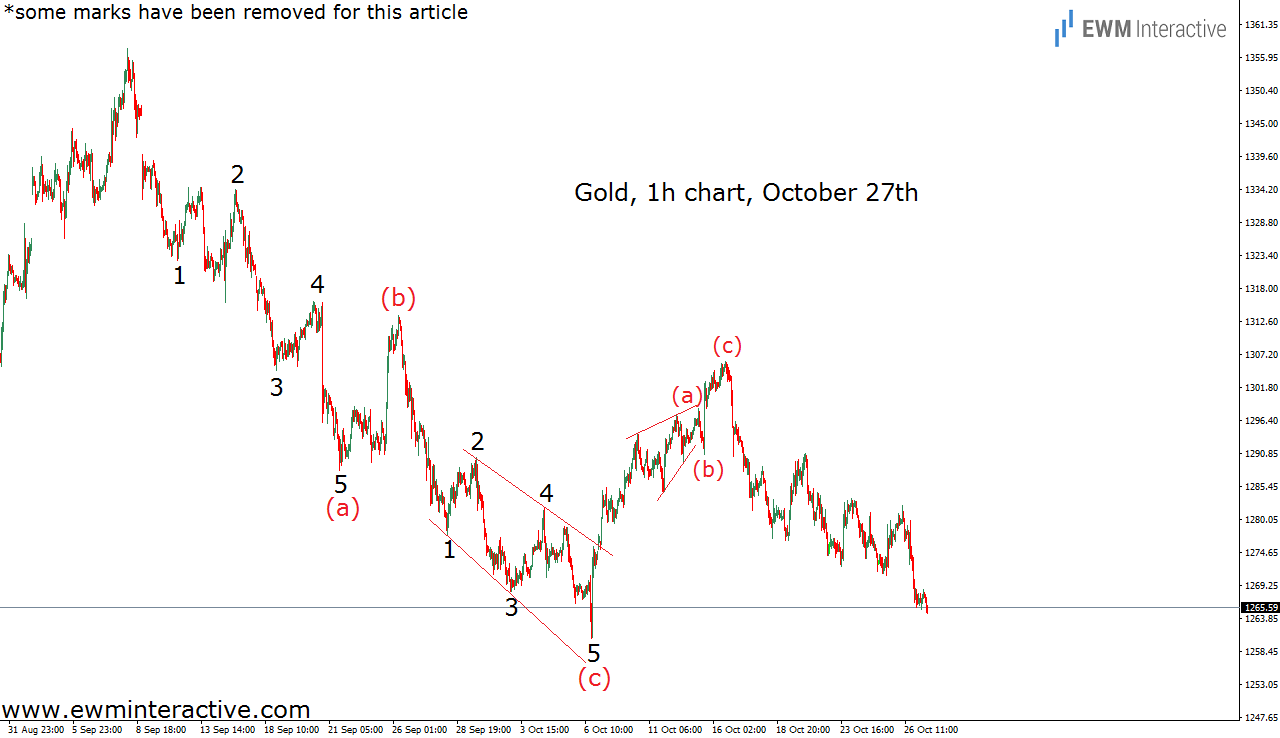
Gold 1 H Chart October 27th

$1306 was the best wave (c) was capable of. After that, it did not take long for gold prices to start plunging. Ten trading days and over $40 to the south later, gold trades in the mid-$1260s. Thanks to the Elliott Wave Principle, this is not such a big shock, despite Trump-North Korea, Catalonia and all the other political reasons suggesting gold should rise. Because quite often, the price patterns are much more important than the news.

Original post

Latest comments

Loading next article…
Risk Disclosure: Trading in financial instruments and/or cryptocurrencies involves high risks including the risk of losing some, or all, of your investment amount, and may not be suitable for all investors. Prices of cryptocurrencies are extremely volatile and may be affected by external factors such as financial, regulatory or political events. Trading on margin increases the financial risks.
Before deciding to trade in financial instrument or cryptocurrencies you should be fully informed of the risks and costs associated with trading the financial markets, carefully consider your investment objectives, level of experience, and risk appetite, and seek professional advice where needed.
Fusion Media would like to remind you that the data contained in this website is not necessarily real-time nor accurate. The data and prices on the website are not necessarily provided by any market or exchange, but may be provided by market makers, and so prices may not be accurate and may differ from the actual price at any given market, meaning prices are indicative and not appropriate for trading purposes. Fusion Media and any provider of the data contained in this website will not accept liability for any loss or damage as a result of your trading, or your reliance on the information contained within this website.
It is prohibited to use, store, reproduce, display, modify, transmit or distribute the data contained in this website without the explicit prior written permission of Fusion Media and/or the data provider. All intellectual property rights are reserved by the providers and/or the exchange providing the data contained in this website.
Fusion Media may be compensated by the advertisers that appear on the website, based on your interaction with the advertisements or advertisers.
© 2007-2024 - Fusion Media Limited. All Rights Reserved.