🤑 It doesn’t get more affordable. Grab this 60% OFF Black Friday offer before it disappears…CLAIM SALE

Oil Slips As Gold Rallies

Published 10/10/2017, 02:15 AM
Updated 07/09/2023, 06:31 AM
XAU/USD
-
GC
-
LCO
-
CL
-

Crude oil traded sideways overnight while gold’s rally continued, with volatility dampened by a U.S. and Japan holiday.

Oil

Crude prices finished broadly unchanged overnight with a U.S. holiday meaning New York trading was subdued. Both Brent and WTI took some solace by comments from the OPEC Secretary-General that they were working to create an extension to the production cut deal ahead of the November OPEC meeting.

The comments only temporarily shook crude from its malaise with the rally quickly running out of steam with Brent and WTI closing at 55.80 and 49.40 respectively. Both contracts retain a consolidative look about them near the lows of last week’s trading range, suggesting both are still vulnerable to downside pressure.

Brent trades at 55.95 with support at 55.15 and 54.15 its long-term support line. Resistance is nearby at 56.10 before the double top at 57.35.
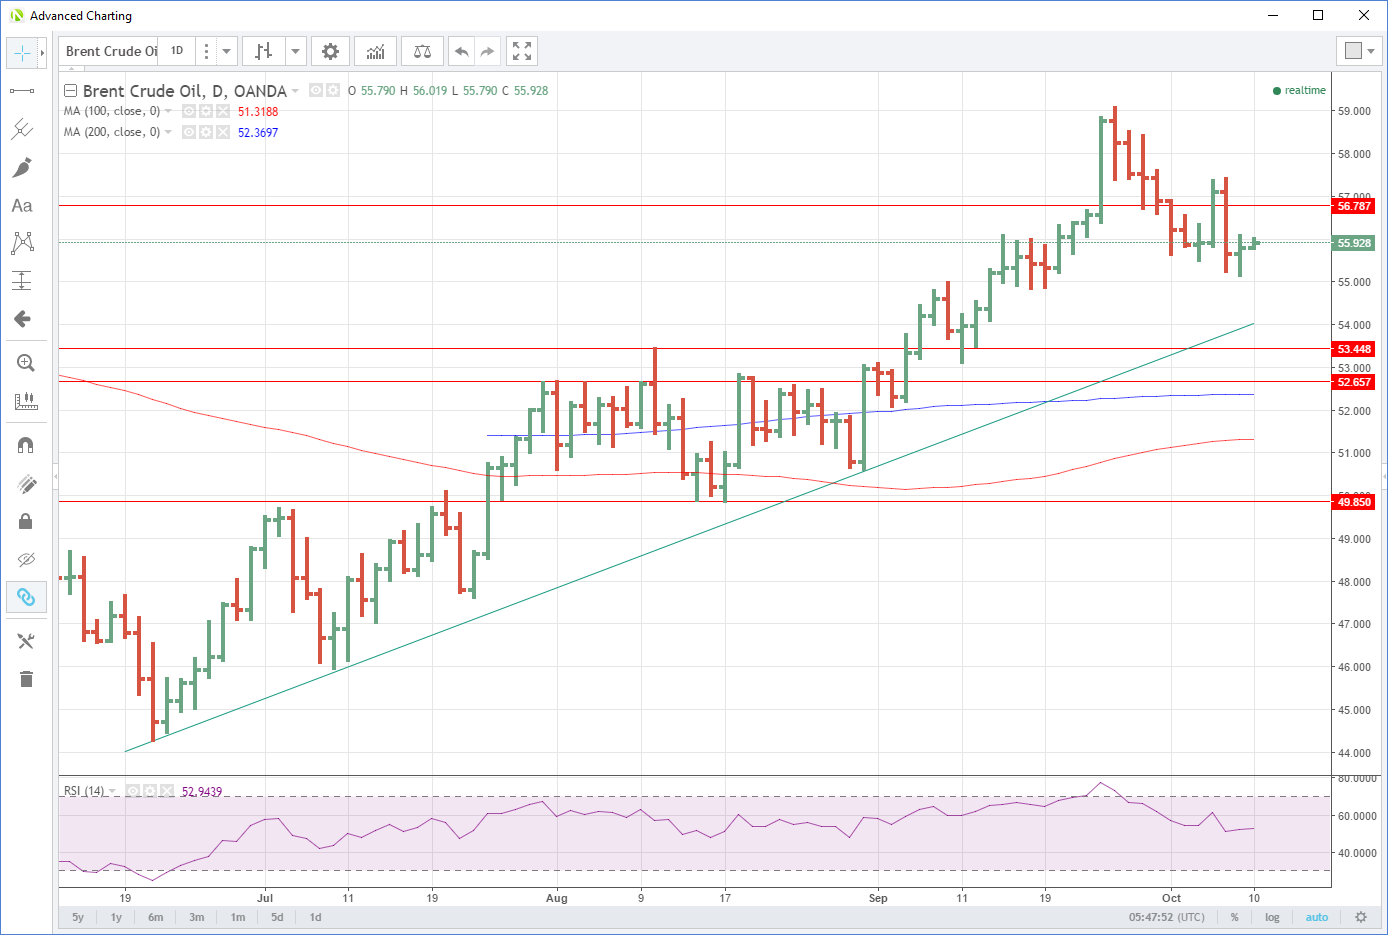
Brent Daily Chart

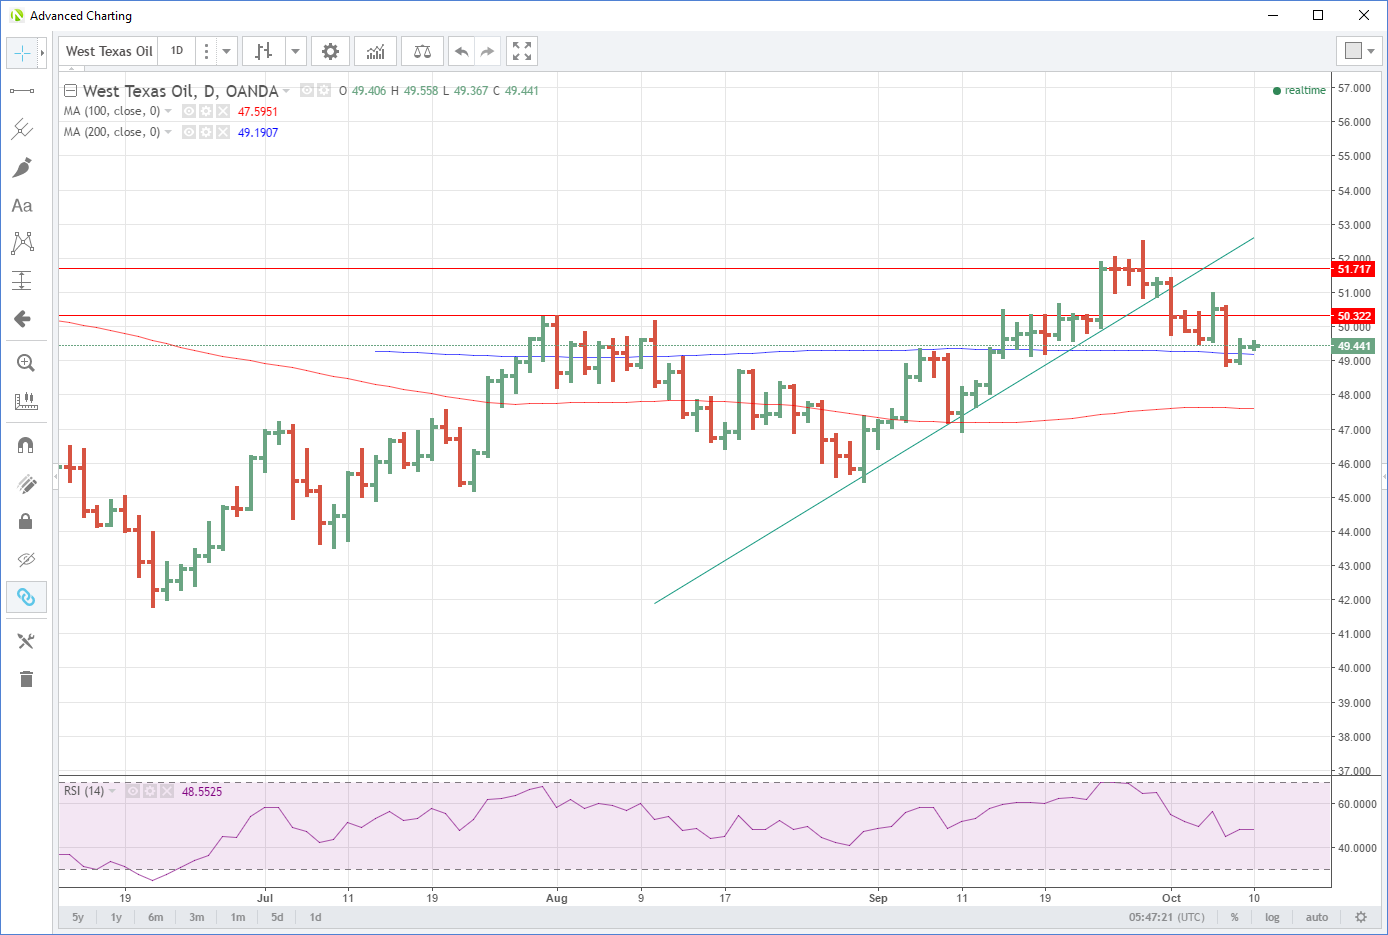
WTI trades at 49.50, just above its 200-day moving average at 49.20, the next support being 48.80. Resistance is at 50.50 and then 51.00.
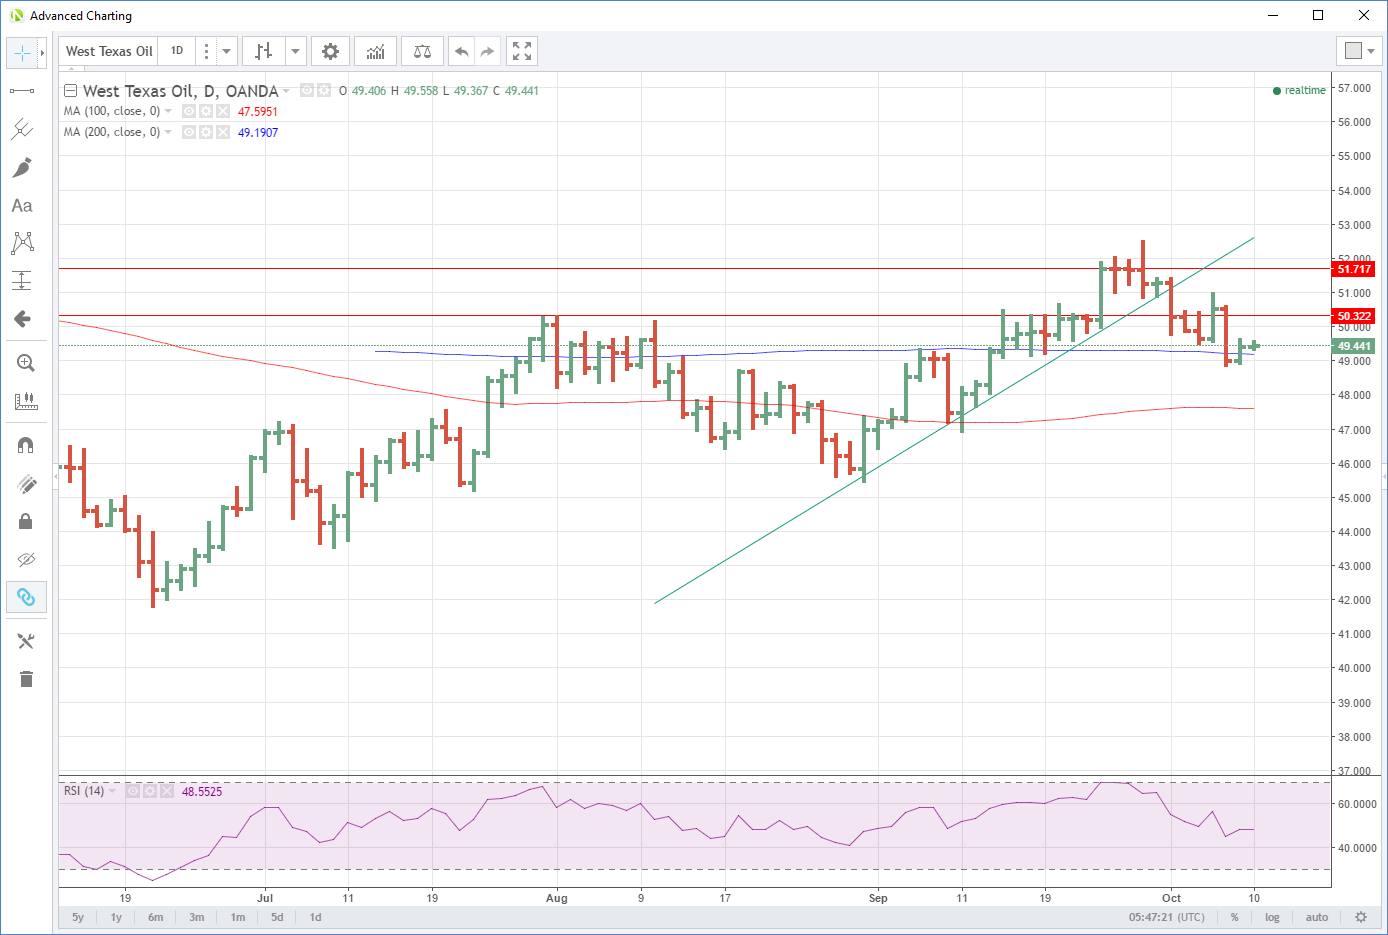
WTI Daily Chart

Gold

Gold’s recovery continued overnight, powering higher by nine dollars to close in New York at 1284.00. With the U.S. session holiday thinned, trading volumes were light, but gold continues to be supported by the ratcheting higher in geopolitical tensions in the Middle East and the Korean peninsula. With the dollar stable overnight, the key will be if gold can hang on to its gains if tensions ease. If so, this may signal that the worst of the correction is now behind us.

Gold trades at 1282.75 and has initial resistance at 1286.00 followed by 1291.00 and 1296.00. The 100-day moving average at 1284.00 this morning will be intra-day support. The crucial level now being Friday’s low at 1260.00. A break of this region suggesting that the pain is not over for long positioning.
Oil Daily Chart

Original post

Latest comments

Loading next article…
Risk Disclosure: Trading in financial instruments and/or cryptocurrencies involves high risks including the risk of losing some, or all, of your investment amount, and may not be suitable for all investors. Prices of cryptocurrencies are extremely volatile and may be affected by external factors such as financial, regulatory or political events. Trading on margin increases the financial risks.
Before deciding to trade in financial instrument or cryptocurrencies you should be fully informed of the risks and costs associated with trading the financial markets, carefully consider your investment objectives, level of experience, and risk appetite, and seek professional advice where needed.
Fusion Media would like to remind you that the data contained in this website is not necessarily real-time nor accurate. The data and prices on the website are not necessarily provided by any market or exchange, but may be provided by market makers, and so prices may not be accurate and may differ from the actual price at any given market, meaning prices are indicative and not appropriate for trading purposes. Fusion Media and any provider of the data contained in this website will not accept liability for any loss or damage as a result of your trading, or your reliance on the information contained within this website.
It is prohibited to use, store, reproduce, display, modify, transmit or distribute the data contained in this website without the explicit prior written permission of Fusion Media and/or the data provider. All intellectual property rights are reserved by the providers and/or the exchange providing the data contained in this website.
Fusion Media may be compensated by the advertisers that appear on the website, based on your interaction with the advertisements or advertisers.
© 2007-2024 - Fusion Media Limited. All Rights Reserved.