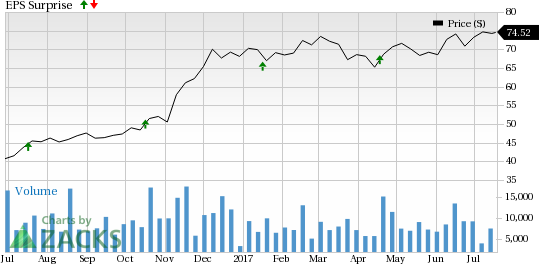
Comerica Incorporated (NYSE:CMA) reported a positive earnings surprise of 7.5% in second-quarter 2017. Adjusted earnings per share of $1.15 surpassed the Zacks Consensus Estimate of $1.07. The adjusted figure excludes restructuring charges and tax benefit from employee stock transactions.
Better-than-expected results reflect higher revenues and lower expenses. Moreover, lower provisions and better credit quality were the tailwinds. A strong capital position was another positive.
Adjusted net income came in at $206 million, up 50.4% year over year. This figure includes $5 million of tax benefits from employee stock transactions and a restructuring charge of $9 million.
Segment wise, on a year-over-year basis, net income increased 19.2% at Business Bank and 76.9% at Wealth Management. Retail Bank segment reported net income of $16 million against a net loss of $2 million in the prior-year quarter. However, the Finance segment recorded net loss in the quarter.
Revenues Improve, Expenses Decline
Comerica’s net revenue for the quarter was $776 million, up 8.8% year over year. Also, the figure surpassed the Zacks Consensus Estimate of $770.8 million.
Net interest income increased 12.4% on a year-over-year basis to $500 million. Moreover, net interest margin expanded 29 basis points (bps) to 3.03%.
Total non-interest income came in at $276 million, up 3.0% on a year-over-year basis. Increased card fees, fiduciary income and service charges on deposit accounts primarily led to the rise.
Further, non-interest expenses totaled $457 million, down 11.8% year over year. The fall was chiefly due to lower salaries, benefit expenses and restructuring charges, partly offset by increased processing fees and other expenses.
Loans Increase, Deposits Decline
As of Jun 30, 2017, total assets and common shareholders' equity were $71.4 billion and $8.0 billion, respectively, compared with $73.0 billion and $7.9 billion as of Mar 31, 2017.
Total loans were up 2.3% on a sequential basis, to $49.4 billion. However, total deposits decreased 3.5% from the previous quarter to $56.8 billion.
Credit Quality Improves
Total non-performing assets decreased 18.3% year over year to $519 million. Also, allowance for loan losses was $705 million, down 3.3% from the prior-year period. Additionally, the allowance for loan losses to total loans ratio was 1.43% as of Jun 30, 2017, down 2 bps year over year.
Further, net loan charge-offs declined 61.7% on a year-over-year basis to $18 million. In addition, provision for credit losses declined 65.3% year over year to $17 million.
Capital Position Strengthens
The company's tangible common equity ratio improved 39 bps year over year to 10.37% as of Jun 30, 2017. Further, common equity Tier 1 and tier 1 risk-based capital ratio was 11.51%, up from 10.49% in the prior-year quarter. Total risk-based capital ratio was 13.66%, up 92 bps from the prior-year quarter.
Capital Deployment Update
Notably, during the reported quarter, Comerica repurchased 2 million shares under its existing equity repurchase program. This, combined with dividends, resulted in a total payout of $185 million to shareholders.
Impressive Outlook for 2017
Comerica provided following guidance for 2017 assuming continuation of the current economic environment and the persistent low rates, along with contributions from the GEAR Up initiative of $30 million in revenues and $125 million in expense savings:
The company anticipates higher net interest income, including the benefit of short-term rate increase in Dec 2016, Mar 2017 and Jun 2017, loan growth and debt maturities. Notably, the recent rise in short-term rates is likely to be over $30 million for the upcoming quarters, assuming a 25% deposit beta.
Non-interest income is expected to increase 4–6%. The rise is expected on GEAR Up opportunities, modest growth in treasury management and card fees, along with wealth management products, including fiduciary and brokerage services.
Non-interest expenses are predicted to be lower, excluding an estimated $40–$50 million restructuring expense. Notably, an additional $125 million in GEAR Up savings is expected. Technology costs and typical inflationary pressure can be offsetting factors. Including restructuring charges, expenses are projected to decrease about 4%.
Provision for credit losses is likely to remain low, with steady performance in overall portfolio. Notably, net charge-offs are expected to remain low while provisions are expected to be in the range of 20–25 bps.
Income tax expenses are anticipated to be approximately 31% of pre-tax income on the assumption of no tax impact from employee stock transactions.
Comerica expects average loan growth to be 1%. Management expects loan growth to be 3%, if Mortgage Banker Finance and Energy segments are excluded.
Our Viewpoint
The company should benefit from its ongoing strategic initiatives. Additionally, its improving credit quality should support its financials in the quarters ahead. Further, the top-line continues to benefit from loan growth and easing pressure on margins.
Comerica Incorporated Price and EPS Surprise
Currently, Comerica has a Zacks Rank #2 (Buy). You can see the complete list of today’s Zacks #1 Rank (Strong Buy) stocks here.
Citigroup Inc. (NYSE:C) delivered a positive earnings surprise of 5.0% in second-quarter 2017, riding on higher revenues. The company’s income from continuing operations per share of $1.27 for the quarter outpaced the Zacks Consensus Estimate of $1.21. Also, earnings compared favorably with the year-ago figure of $1.25 per share.
Among other finance stocks, Morgan Stanley (NYSE:MS) and U.S. Bancorp (NYSE:USB) are scheduled to report second-quarter 2017 earnings on Jul 19.
5 Trades Could Profit "Big-League" from Trump Policies
If the stocks above spark your interest, wait until you look into companies primed to make substantial gains from Washington's changing course.
Today Zacks reveals 5 tickers that could benefit from new trends like streamlined drug approvals, tariffs, lower taxes, higher interest rates, and spending surges in defense and infrastructure. See these buy recommendations now >>
Comerica Incorporated (CMA): Free Stock Analysis Report
U.S. Bancorp (USB): Free Stock Analysis Report
Citigroup Inc. (C): Free Stock Analysis Report
Morgan Stanley (MS): Free Stock Analysis Report
Original post

