Activity in the art/collectible markets yesterday caught my attention. A once-lost portrait of Christ by the iconic Renaissance man Leonardo da Vinci sold Wednesday at auction for $450 million, roughly triple its anticipated price and the most ever paid for a creative work of human genius.
Bloomberg reported that the largest known fancy intense pink diamond went unsold at Sotheby’s on Wednesday amid jitters in the final round of the Geneva fall auction season. Could this bipolar activity be sending an important message to stocks and the broad markets?
This activity in the art/collectibles markets got me curious to see what the stock pattern of Sotheby’s (NYSE:BID) looked like. See BID below.
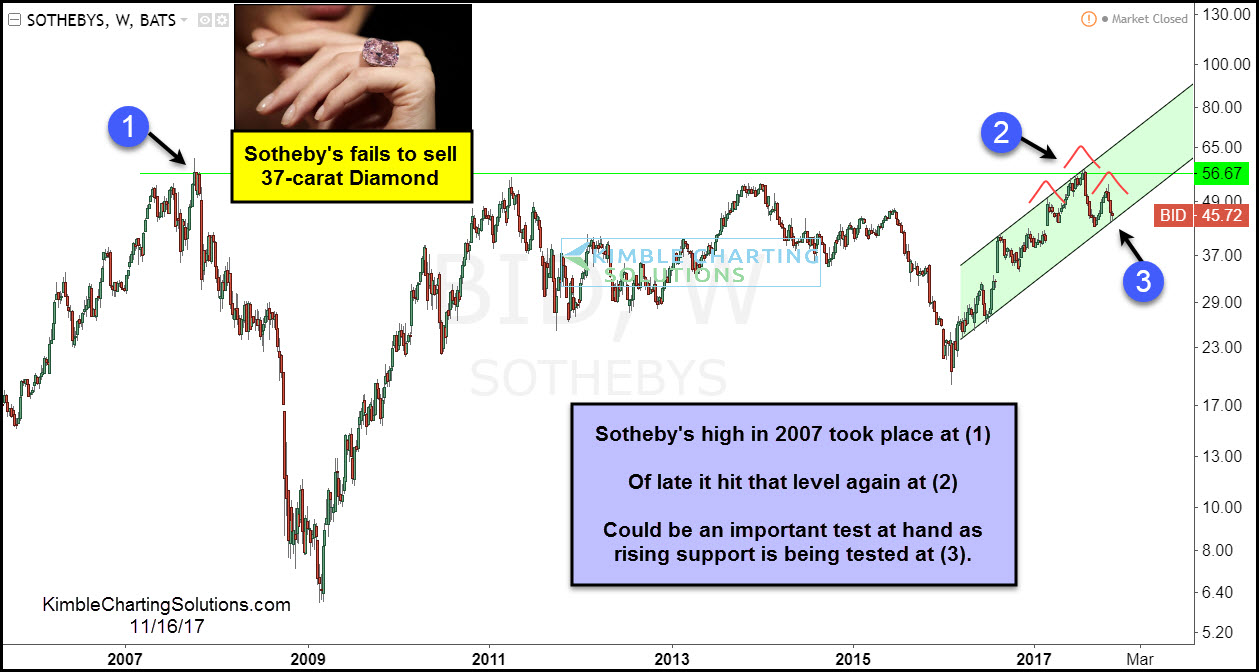
Sotheby’s peaked in 2007 at the $57 zone at (1). After falling hard during the financial crisis along with the majority of stocks, it has rallied off the 2009 lows to get back to 2007 highs again this past summer at (2). While testing 2007 highs in July, BID created a small bearish reversal pattern (bearish wick). Since creating this pattern, despite the broad market moving higher, BID has not.
While testing the 2007 highs, has BID been creating a head & shoulders topping pattern? It is too early to tell, possible though.
BID remains inside of 2-year rising channel and is testing rising support at (3) above. BID has an unfilled gap near the $30 zone, roughly 30% below current prices. What BID does at (3) could become very important to the intermediate term for this company and could send an important message to this sector and potentially the broad market overall.

