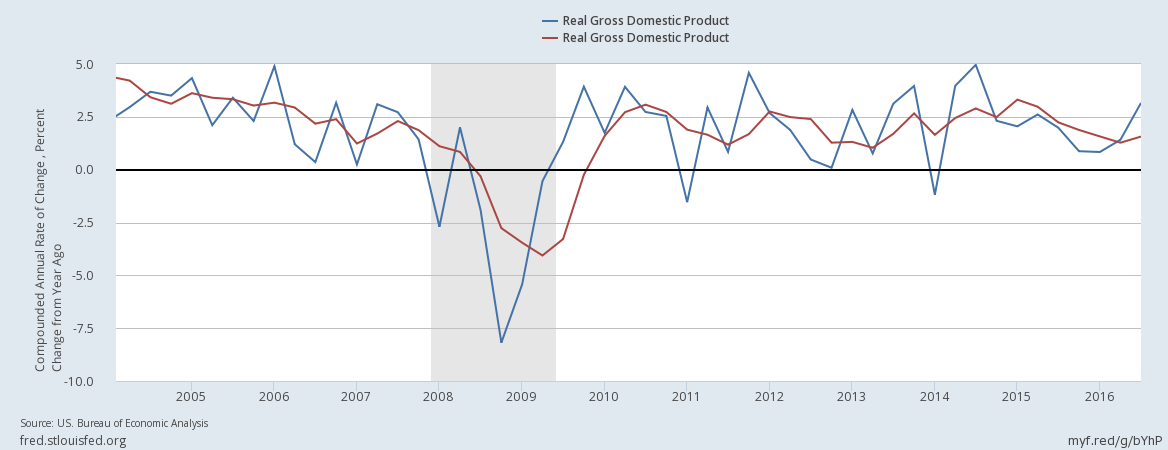
Wow. According to the headlines, the US economy has surged to 3.2% growth in the third quarter. Hope you are feeling it!
Follow up:
To begin, I hate the quarter-over-quarter methodology which produces the headline GDP. It exaggerates any change in growth by compounding relatively small changes, making them huge changes.

The red line in the above chart is the percent change from the same quarter one year ago (year-over-year change). Note how relatively smooth the red line is compared to the compounded jumping around of headline GDP (blue line).
Anyone believing the economy is rolling along at 3.2 % is on drugs - and the 1.6 % growth from one year ago is a much more representative quantification for the US economy.
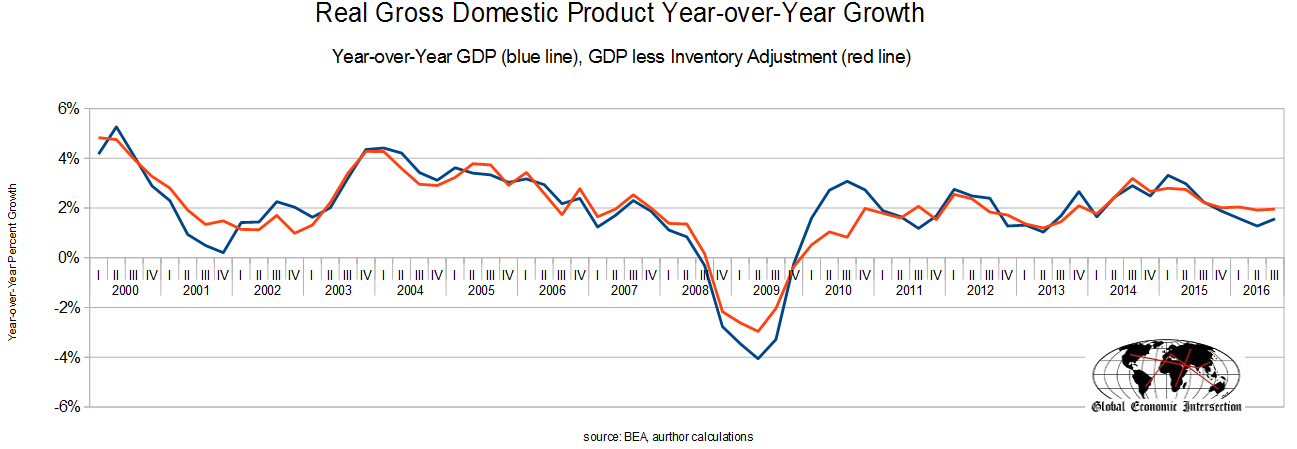
But alas, there is a second problem which creates a lot of noise - change in private inventory. For whatever strange reason GDP recognizes goods warehoused but not yet sold to the final user. Removing the adjustment creates a much smoother and more realistic metric.

I find little logic in the inventory adjustment - as inventory growth can be a precursor to a recession - and speaking as an industrial engineer - inventory change may or may not be an economically positive event
You will note that despite the great jump in GDP in 3Q2016, the above graph shows the economy is little changed for the last year.
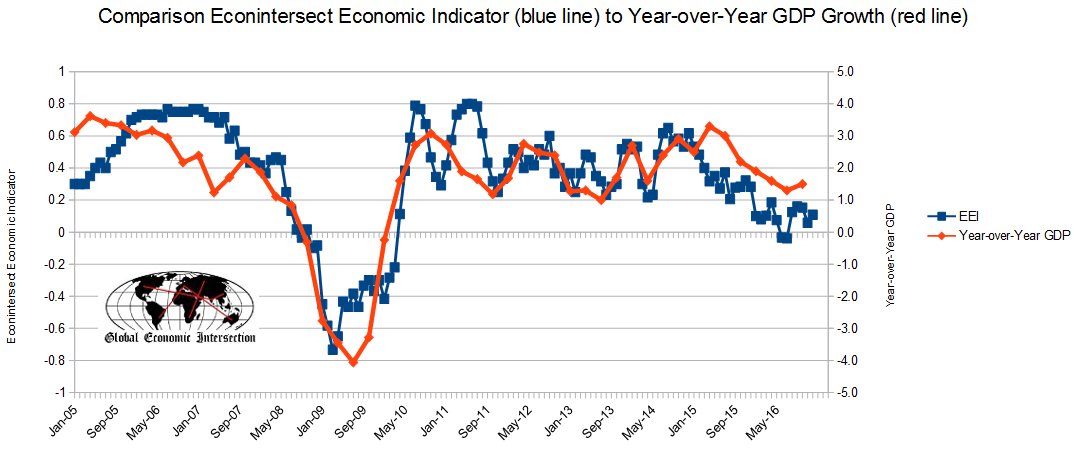
We do see some very moderate growth in our December 2016 economic forecast - but far from suggesting the economy is rumbling along at 3.2 %

Other Economic News this Week:
The Econintersect Economic Index for December 2016 improved but still with the economic outlook for weak growth. The index remains near the lowest value since the end of the Great Recession. This month there are no recession warning flags. Six-month employment growth forecast indicates minor improvement in the rate of growth.
Weekly Economic Release Scorecard:

