There is an old adage that bulls get fat, bears get fat, but pigs get slaughtered. I guess that is another way of saying to not overstay your welcome on one side of the market and to know when to take profits.
This is how I felt about bonds last week.
But, before I explain, let me take a moment to recap our history and perspective on bonds. For those that followed our work over the years, you would know that we called for a top to the bond market on June 27, 2016, with the market striking its multi-year highs within a week of our call. Since that call, TLT dropped 22%, until we saw the bottoming structure develop in late 2018.
So, in November of 2018, I noted I was going long TLT just as it broke below the 113 level. At the time, many were telling me that I was crazy to go long bonds, as the Fed was still raising rates. The main reason many thought I was crazy was that “you cannot fight the Fed.”
Well, in my case, I recognized that the Fed cannot fight the market. And, the market was suggesting to me that it was bottoming out and about to turn up quite strongly. In fact, back in the fall of 2018, we set our ideal target for this rally at the 135/136 region before we even bottomed. Yes, you heard me right. We were able to identify our ideal target region for a rally which had not even begun before TLT even bottomed. That is the power of Elliott Wave analysis in being able to provide context for the market which no other methodology can provide quite as accurately.
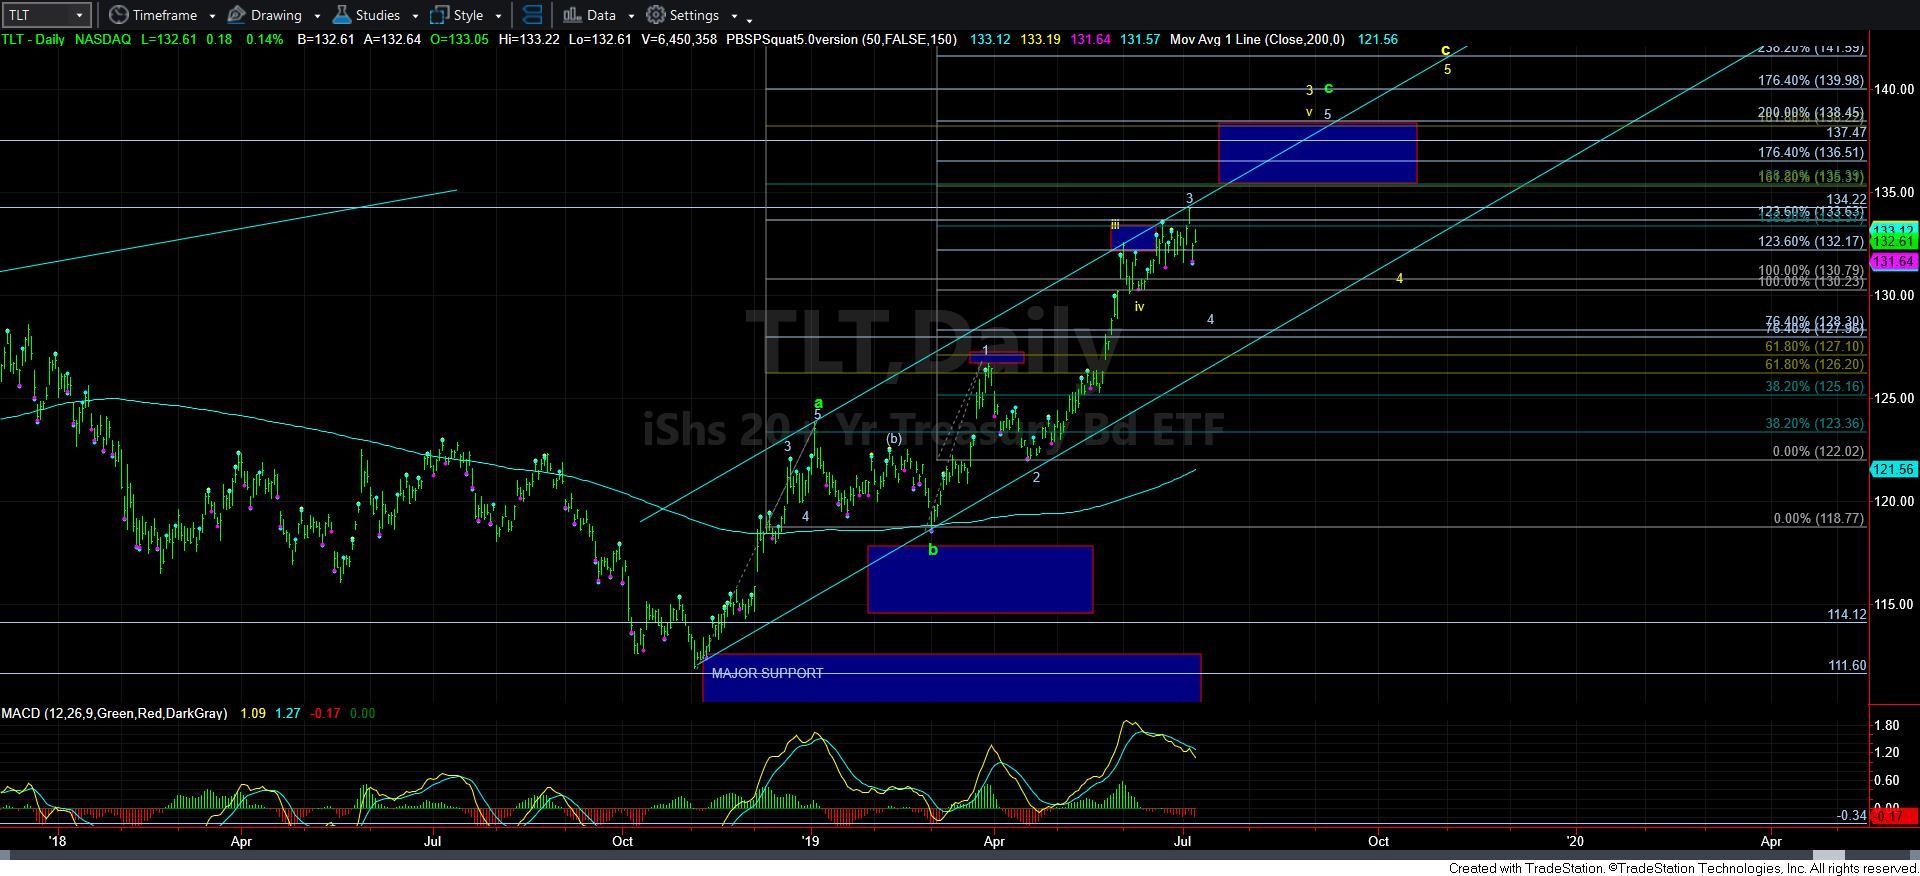
Since that time, TLT has moved from just below 113, when we went long, to as high as 134.29. And, we are approaching our ideal target set out in the fall of 2018.
This past Wednesday, right before the July 4th holiday, I alerted my subscribers that I was likely going to cash in some of my long positions in TLT, and did so once we broke over 134. Since then, TLT hit a high of 134.29, and has pulled back. The question now becomes, how much of a pullback will we see?
My preference is to see TLT pull back down towards the 128-130 region. Should we see that then I will add back the long positions I cashed in last week. However, should we continue higher in the coming weeks without much of a pullback, then I will continue to sell into this rally until I no longer hold any long positions.
When I set out in this trade back in November, I outlined that my ideal target from the 113 region would be the 135/136 region. While there is even potential for this rally to continue on to the 138/139 region, I will be cashing in my longs on the next move higher, as the heart of the rally I expected back in November has almost completed. And, while the market can certainly head higher than 139 (and I will reassess the structure once we do begin to move higher), I do not want to be a pig. I will gladly cash in my 20% return and look for another place to deploy the cash, preferably in the stock market.
As the structure stands now, I see anything north of 139 as being quite risky. But, again, I will reassess once the next smaller degree rally phase takes hold to 135+.

