“The economy is recovering.”
How many times have you heard or read something similar to this statement recently?
Comments like this are repeated so often in the media that the premise of a mending economy becomes accepted as truth.
Granted, there are reasons to be optimistic.
The unemployment rate has fallen from a high of 10.0% in 2009 down to 6.1% in June. Also, the four-week moving average of jobless claims has hit a low not seen since mid-2007 – before the onset of the recession.
But here’s a sobering fact that puts our nation’s employment situation into perspective.
There are 3.7 million fewer full-time workers employed today than in November 2007, even though the U.S. population has increased by 15.4 million.
Clearly, all is not well.
As you know, first-quarter U.S. gross domestic product (GDP) was an unmitigated disaster, declining by 2.9% quarter over quarter. Even with a widely anticipated snapback in the second quarter, it’s likely that total growth in the first half of 2014 will be close to zero.
The consensus 2014 real GDP growth forecast (the median estimate from economists polled by Bloomberg) has collapsed from 2.9% just a few months ago to 1.7% currently.
That’s not an economy on the mend…it’s one that’s falling below stall speed.
Nonetheless, the Federal Reserve continues to taper its current asset purchase program, with an explicit goal of ending quantitative easing around October.
At times like this, it’s often helpful to look at the big picture.
The Root of the Problem
There’s one metric in particular that I believe clarifies a great deal about this confusing economic environment.
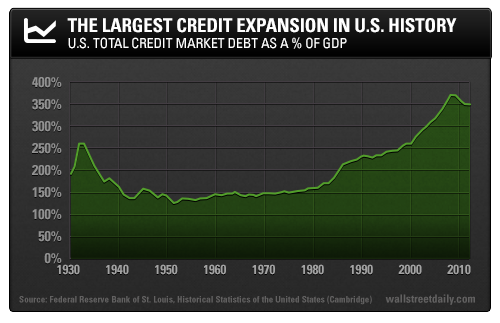
The chart below shows total U.S. credit market debt relative to GDP.

This is perhaps the most revealing economic chart in existence.
It speaks volumes. It helps to explain so much of what has gone on in our economy, as well as what the future may hold in store for us.
Basically, we’ve built up a ton of debt.
From 1980 to 2008, a historic credit expansion took total debt levels (including household, corporate, and government) to around 375% of economic output. By comparison, debt levels reached approximately 260% of GDP before the Great Depression.
Things seemed to be going really well before the most recent recession because we were in the midst of a credit-fueled spending binge.
Then the Credit Crisis hit, causing the Fed to take extraordinary actions to help stabilize the economy and financial system.
But credit growth has failed to regain its previous upward trajectory, despite continued Fed stimulus. Total credit market debt to GDP has stabilized around 350%, which is still a high number. Overall, very little deleveraging has occurred.
The debt overhang and lack of further credit growth help to explain why this post-recession recovery has been so weak relative to past post-recession recoveries. After all, our economy is credit-based.
The chart above also helps to explain why the financial markets have needed continued coddling for so long.
If the economy was left to its own devices, then debt levels would undoubtedly fall to a more normal level. Stimulus is aimed at preventing this by boosting financial asset prices and helping households and businesses finance new spending.
The financial markets are once again being weaned from the QE teat. As I’ve said before, I think it’s highly likely that deleveraging will ensue and volatility will return with a vengeance.
It should be an interesting autumn…or should I say, fall.
Safe investing,
BY Alan Gula, CFA
