Are We In The Beginning Of A Prolonged Market Pullback?

Published 03/14/2014, 01:47 AM
Updated 07/09/2023, 06:31 AM
US500
-
DJI
-
NYA
-
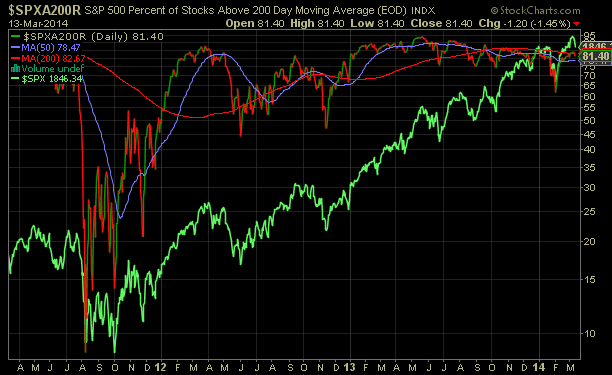
The Dow Jones Industrial Average fell over 230 points yesterday (-1.41%), the S&P 500 Index declined a lesser 1.17% and many market participants are evaluating whether this is the beginning of a more prolonged market pullback. Market technicians are citing a number of technical factors that may be a precursor to a more sustained market decline. One factor which has been getting a lot of attention is the declining number of stocks within, say the S&P 500 Index, trading above their 200 day moving average. Thomson Reuters' AlphaNow site published an article yesterday and written by ETF Guide, Is The Bull Market Weakening Or Gaining Strength? A chart included in the analysis was the one below that clearly shows a declining percentage of S&P 500 stocks trading above their 200 day moving average.
SPX Daily Chart 

In the article, the author notes,

"The broader index may be making new all-time highs, but less and less of its components are. This means the market is being driven higher by fewer and fewer companies and solely by those companies with the biggest market caps that have the larger effects on the indices (emphasis added)."
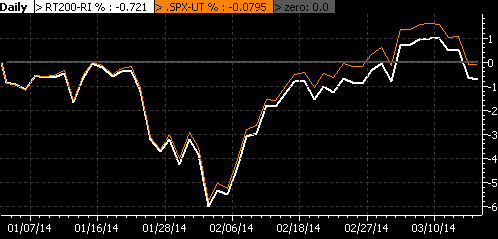
However, instead of the larger capitalization stocks driving the market to new highs, it is the smaller cap stocks. The below chart shows the mega cap stocks (white line), the Russell 200 Index, and this index is actually underperforming the more comprehensive S&P 500 Index.
SPX Daily Chart 

The next chart shows the S&P 600 Small Cap ETF compared to the S&P 500 Index. In this case as well, small caps are outperforming large cap stocks.
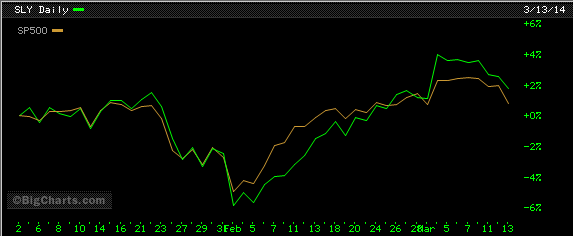
SLY Daily Chart 

Further, the market strength has really been evident in the small cap stock space. Much is being written about the extended valuations in small cap stocks:

Ryan's article provides a detail review of future small cap returns when small cap stocks are trading at levels similar to today. At HORAN, we eliminated and/or reduced small cap exposure in our clients' accounts recently due to valuation concerns.
 
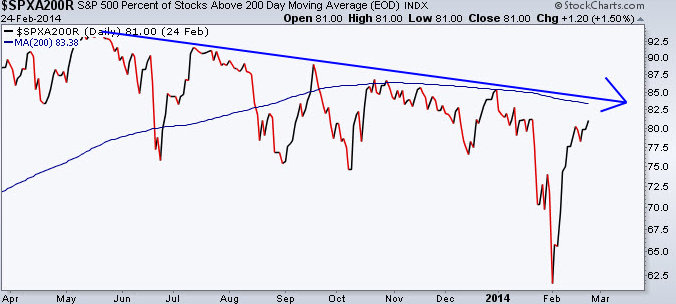
So, getting back to the AlphaNow article question, Is the Bull Market Weakening? The issue of the declining number of stocks above their 200 day moving average is certainly an issue worth watching. However, as the below chart shows, last year the market generated returns in excess of 30% at a time when a smaller percentage of stocks in the S&P 500 Index were trading above their 200 day moving average.
SPX Dailt Chart 

Also, looking at a broader index like the NYSE Composite Index, the percentage of stocks trading above their 200 day moving average has been increasing this year. The NYSE Composite consists of 1,867 companies (1,518 of which are U.S. companies.) In actuality, maybe we are seeing a broader more global participation in this market advance.
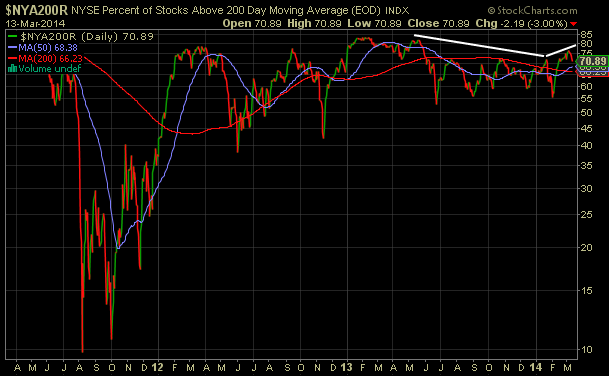
NYA200R Daily Chart 

From our firm's perspective, consolidation of market gains generated over the last year and a half would be constructive for another move higher for the market. The market has consistently stair-stepped its way higher since late 2012.
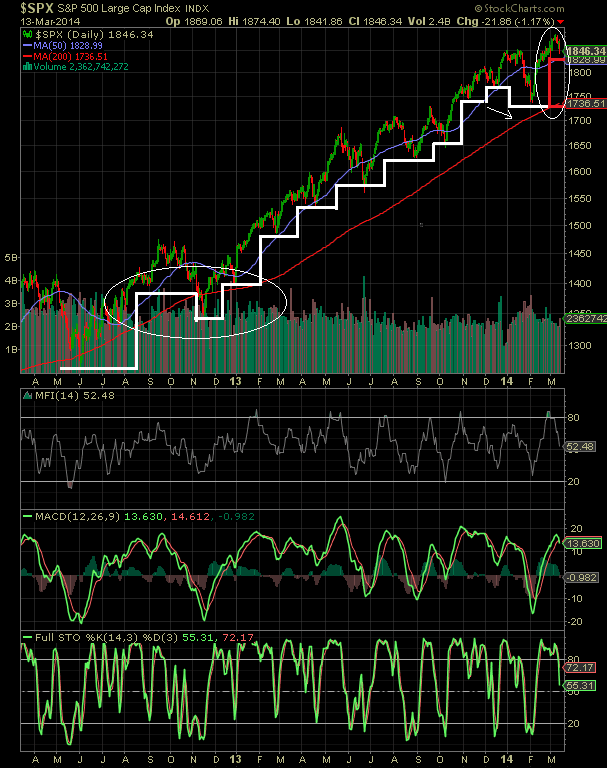
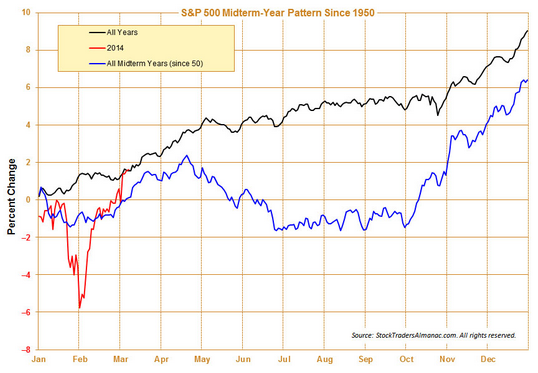
However, from a technical point of view 2014 could be a more "sell in May" type of year. Source: Stock Trader's Almanac Over riding these technical issues will be company fundamentals. Weather has been the excuse of the day for poor earnings reports for a number of firms reporting over the last 60 to 90 days. Additionally, geopolitical events (Russia/Ukraine) are also influencing recent market actions. We will address more of these issues in our upcoming first quarter investor letter.SPX Daily Chart

However, from a technical point of view 2014 could be a more "sell in May" type of year.
 S&P Midtern Pattern Since 1950
Over riding these technical issues will be company fundamentals. Weather has been the excuse of the day for poor earnings reports for a number of firms reporting over the last 60 to 90 days. Additionally, geopolitical events (Russia/Ukraine) are also influencing recent market actions. We will address more of these issues in our upcoming first quarter investor letter.


Latest comments

Loading next article…
Risk Disclosure: Trading in financial instruments and/or cryptocurrencies involves high risks including the risk of losing some, or all, of your investment amount, and may not be suitable for all investors. Prices of cryptocurrencies are extremely volatile and may be affected by external factors such as financial, regulatory or political events. Trading on margin increases the financial risks.
Before deciding to trade in financial instrument or cryptocurrencies you should be fully informed of the risks and costs associated with trading the financial markets, carefully consider your investment objectives, level of experience, and risk appetite, and seek professional advice where needed.
Fusion Media would like to remind you that the data contained in this website is not necessarily real-time nor accurate. The data and prices on the website are not necessarily provided by any market or exchange, but may be provided by market makers, and so prices may not be accurate and may differ from the actual price at any given market, meaning prices are indicative and not appropriate for trading purposes. Fusion Media and any provider of the data contained in this website will not accept liability for any loss or damage as a result of your trading, or your reliance on the information contained within this website.
It is prohibited to use, store, reproduce, display, modify, transmit or distribute the data contained in this website without the explicit prior written permission of Fusion Media and/or the data provider. All intellectual property rights are reserved by the providers and/or the exchange providing the data contained in this website.
Fusion Media may be compensated by the advertisers that appear on the website, based on your interaction with the advertisements or advertisers.
© 2007-2025 - Fusion Media Limited. All Rights Reserved.