With the approach of the "fiscal cliff" in the US, it might be useful to consider what effect significant deficit reduction might have on the Treasury market. Conventional wisdom appears to be all over the map.
Cardiff Garcia at FT Alphaville, quoting a SocGen report, suggests that a reduction in the supply of Treasuries would "be undoubtedly bullish" while an extension of current fiscal policies "could put upward pressure on long-term interest rates".
In January of this year, Lord Skidelsky, in a piece rejecting the commonsense notion that "debt matters", wrote that "there is no connection between the size of national debt and the price that a government must pay to finance it".
And, in July, The Economist said:
There have been crises before, but not even the Great Depression pushed bond yields down this far or this widely. The records being set in the markets are due to a combination of peculiar circumstances, cyclical swings and historical shifts. Together they have produced a bond market which is behaving in a way never seen before.
But a brief look at a historical chart suggests that each of these opinions is wrong. Contrary to Lord Skidelsky, there does seem to be some connection between the size of the debt and the price that we must pay for it. Contrary to The Economist, we have been here before. And despite what SocGen might say, the chart gives the impression that debt reduction would be quite negative for Treasuries (IEF).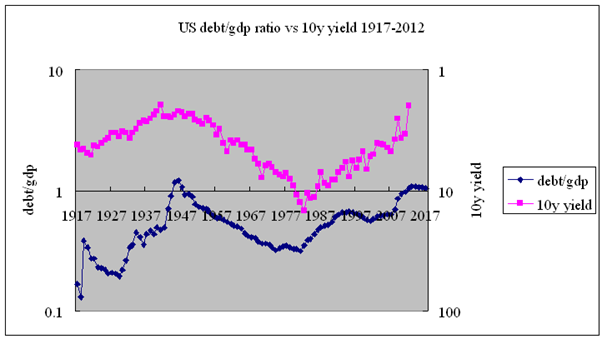
(Note: Unless otherwise stated all GDP and fiscal data in this article come from usgovernmentspending.com, and all CPI, interest rate, and earnings yield data comes from Robert Shiller)
This is certainly unexpected. As I have noted before, the great correlation with yields prior to our move away from the gold standard was the correspondence between interest rates and the CPI level, known as Gibson's Paradox. 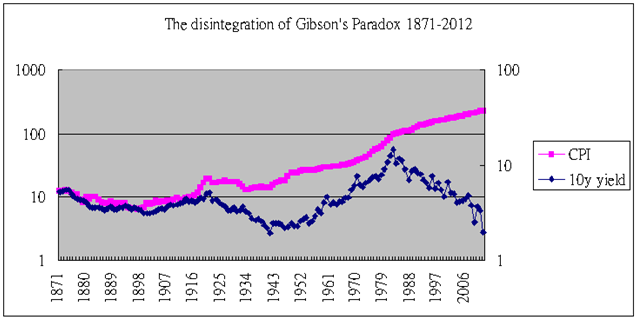
Up until the establishment of the Federal Reserve, the correspondence was nearly 1:1. Since then, there has still been a relationship, although it grows ever fainter.
I don't have data going back far enough, but eyeballing these two charts (here and here) suggests that the yield vs debt/GDP correlation is rather old. In the early 1860s, US yields peaked while debt/gdp bottomed out. Unfortunately, yields move rather ponderously, so we don't have a lot of movement to go on.
My impression of British yields is that they were positively correlated with British debt/GDP during the 19th century, but then became inversely correlated during the 20th. In Japan, at present, debt has famously soared with bonds.
This raises a number of questions, of course. Why would debt and the price of debt ever be negatively correlated? Does one push the other, or are they both products of a third force or set of forces? Or is it merely coincidental?
And, assuming that it is not coincidental, what accounts for reversals in trends? Kenneth Rogoff's and Carmen Reinhart's controversial paper on the 90% historical threshold for debt/GDP comes to mind. Is there some sort of limit to how much debt a government can take on that finally forces markets to stop lending? Or, does inflation finally kick in and turn things around? And, then what accounts for the desire of markets to start lending again?
Since the end of Bretton Woods, the accumulation of debt has largely been countercyclical with respect to PE ratios (meaning that deficits and spending have largely trended with earnings yields). 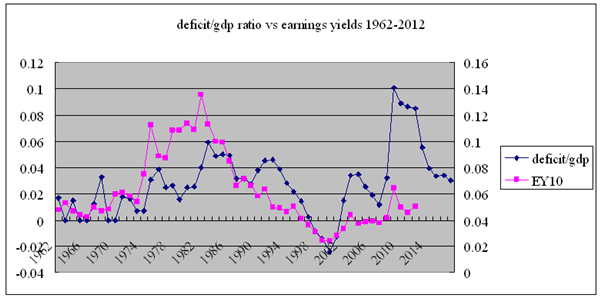
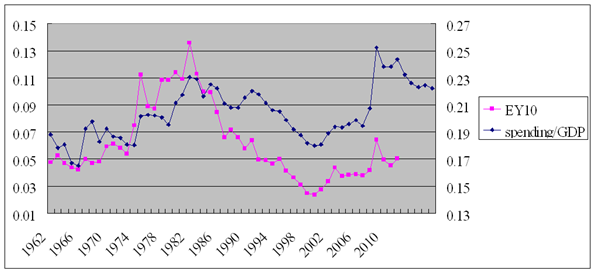
This would seem to make sense. As the government acquired additional revenue through taxes during bull markets, deficit levels would fall. Simultaneously, commodity prices would also be falling, putting (I assume) less strain on the spending side. By the time the government was running a surplus at the turn of the century, for example, the stock market was putting in record highs and oil was aiming for $10/bl.
As you can see from the charts above, although the borrowing and spending rates trend with earnings yields, they appear to have slightly different trajectories. Interestingly, the spread between the deficit/GDP ratio and earnings yield resembles the debt/GDP ratio.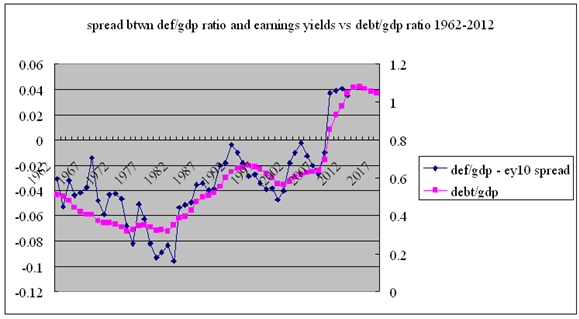
And, the spread between the spending/GDP ratio and earnings yield looks essentially the same.
But, were we to take these relationships seriously, it would suggest that rising earning yields are detrimental to debt levels and/or beneficial to GDP but also, paradoxically, linked to accelerated growth in deficits and spending and/or declining GDP. Falling earnings yields would be linked to growing debt and/or lower GDP but also reductions in deficit and spending levels.
By way of analogy, it would seem as if the more we exercise (rising earnings yields), the more our appetite grows (rising spending and deficits). And when we stop exercising (falling earnings yields), our appetite slackens although we rarely fast. And, somehow, we never do manage to lose the weight.
But, is that all about to change as we approach historic heights in US debt loads and lows in Treasury yields?
If we were to assume that earning yields are to continue rising over the next five to ten years (although I believe that in the near-term they are set to fall), can deficit levels continue to keep pace? If they cannot, deficits must drop and/or GDP must rise. A simple solution to that might very well be inflation.
It is difficult to link inflation and debt, except to say that during the period of falling debt levels from 1947 to 1981, inflation averaged about 4.7%. Since then, in three decades of rising debt, inflation has averaged about 3.1%. The beginning and end of the 1947-1981 period were punctuated by double-digit inflation, but the middle portion, when earning yields were very low, had exceptionally low inflation. During that post-war period, the stock of debt itself, adjusted for inflation, was flat, so the reduction in the debt load came entirely from rising GDP (that is, real GDP plus inflation).
Conclusion
Whether or not we go over the fiscal cliff at the end of the year, from a historical perspective, it would appear that we are at extreme levels in terms of debt and Treasury yields and that these are linked. It is not clear how much of the future trajectory of debt is determined by cyclical market forces such as PE ratios and how much is determined by legislative action.
The main problem is that the radical transformation in our monetary system since the establishment of the Fed and then the end of Bretton Woods has left us economically uprooted. We have very little economic and market data to go on and the data we do have has been accumulated during major fundamental changes in our economic system.
It now appears to be a commonplace that debt doesn't matter as long as it doesn't lead to inflation, but so little is known about the mechanisms involved that one has to question how true that claim is. On the other hand, the inverse correlation between debt and Treasury yields means something quite counterintuitive is going on.
So, what about the fiscal cliff? If the deficit is cut, one would have to regard that as bearish for Treasuries, unless those cuts should lead to or contribute to a higher debt load because of reduced GDP growth. Contrariwise, continued borrowing could contribute to a rise in nominal GDP that offset the additional debt, although it is unclear how long that boost would last or if it would not ultimately be inflationary.
Of course, it may be possible that Treasury yields will fall indefinitely and debt will continue to outpace GDP out into a glorious infinite future, but I would not take the monetary theorists' word for it, nor is it time to buy into such an hypothesis by going long Treasuries.
- English (UK)
- English (India)
- English (Canada)
- English (Australia)
- English (South Africa)
- English (Philippines)
- English (Nigeria)
- Deutsch
- Español (España)
- Español (México)
- Français
- Italiano
- Nederlands
- Português (Portugal)
- Polski
- Português (Brasil)
- Русский
- Türkçe
- العربية
- Ελληνικά
- Svenska
- Suomi
- עברית
- 日本語
- 한국어
- 简体中文
- 繁體中文
- Bahasa Indonesia
- Bahasa Melayu
- ไทย
- Tiếng Việt
- हिंदी
Are We Driving Bond Bulls Over A Fiscal Cliff?
Latest comments
Loading next article…
Install Our App
Risk Disclosure: Trading in financial instruments and/or cryptocurrencies involves high risks including the risk of losing some, or all, of your investment amount, and may not be suitable for all investors. Prices of cryptocurrencies are extremely volatile and may be affected by external factors such as financial, regulatory or political events. Trading on margin increases the financial risks.
Before deciding to trade in financial instrument or cryptocurrencies you should be fully informed of the risks and costs associated with trading the financial markets, carefully consider your investment objectives, level of experience, and risk appetite, and seek professional advice where needed.
Fusion Media would like to remind you that the data contained in this website is not necessarily real-time nor accurate. The data and prices on the website are not necessarily provided by any market or exchange, but may be provided by market makers, and so prices may not be accurate and may differ from the actual price at any given market, meaning prices are indicative and not appropriate for trading purposes. Fusion Media and any provider of the data contained in this website will not accept liability for any loss or damage as a result of your trading, or your reliance on the information contained within this website.
It is prohibited to use, store, reproduce, display, modify, transmit or distribute the data contained in this website without the explicit prior written permission of Fusion Media and/or the data provider. All intellectual property rights are reserved by the providers and/or the exchange providing the data contained in this website.
Fusion Media may be compensated by the advertisers that appear on the website, based on your interaction with the advertisements or advertisers.
© 2007-2025 - Fusion Media Limited. All Rights Reserved.
