Investing.com’s stocks of the week
With the S&P up 30% from the inception of Operation Twist, there’s little question that this piece of monetary policy has successfully steered investors toward risk and something that might help to spark a virtuous cycle that may bring some movement to the economy. Such success is showing in the charts of Treasurys as well but with the twist that long-term rates appear ready to rise as much as short-term rates and something that may stifle that virtuous cycle possibility.
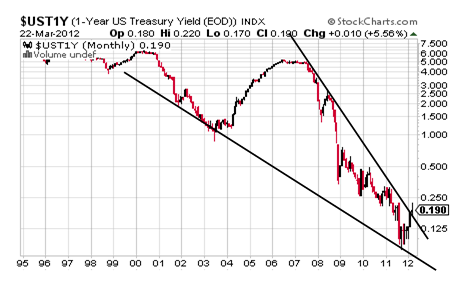
Let’s look first at the short end with a long-term monthly chart of the 1-year yield showing a beautiful and bullish Falling Wedge pattern that is basically confirmed for its target of about 6.0%.
Will it succeed in taking the 1-year yield that high? Maybe but probably not and if it does it will take years and it will depend on this pattern remaining confirmed by staying above 0.125%.Should the 1-year yield remain above 0.125%, though, it probably makes more sense to watch a bottoming pattern that confirms at 0.22% for a target of about 0.36% and a level that would be consistent with the goals of Operation Twist.
One of the other goals of Operation Twist, however, was to keep the long end down in order to keep borrowing rates low for consumers and businesses alike and this goal may just not work out so well in looking at charts of the 10- and 30-year yields and the chart of TBT.
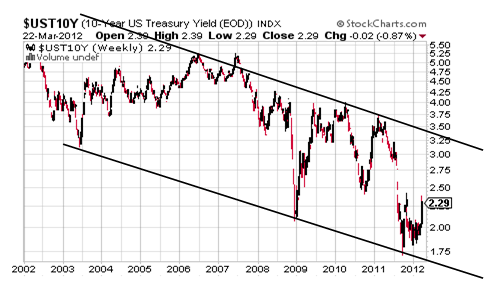
As can be seen in the chart of the 10-year yield, it is trading in what appears to be pretty well-defined Descending Trend Channel that is calling for a move toward its top trendline and something that is supported by a Double Bottom along with upside gaps. All in, it appears as though the 10-year yield could travel up to about 3.25% within a year to two years. Clearly, this would not keep help to keep mortgage rates and other borrowing rates at record lows, but it would help savers to some degree, but the net effect on a fragile economy must be considered and it would seem to be a potential negative that might help to keep the velocity of money at a record low even though it may not be have a tax-like effect in the way that rising gas prices do.
Turning to one of the more mangled charts out there, the 30-year yield looks set to rise up toward 4.25% in response to the potential target-like pull of the top trendline to a large Symmetrical Triangle.
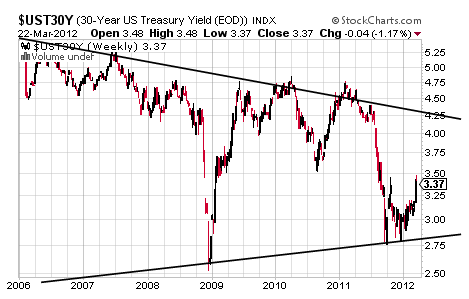
Such a potential move up by the 30-year yield is helped by an unclosed gap at 4.12% along with a basically confirmed Double Bottom pattern that carries a target of 4.25% and these technical aspects would seem to suggest that borrowing costs could be on the rise as was the case with the possibly more important 10-year around those matters.
Lastly, let’s take a look at TBT and an inverse ETF to the long end and it appears to be on the rise in inverse to price.
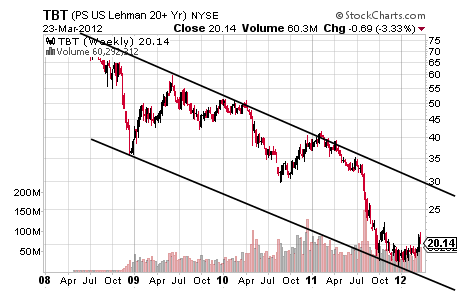
Above $23 and a Rounding Bottom will confirm for a target of very roughly $28.50 and a level that is perfectly consistent with the top trendline level of that Descending Trend Channel.
What makes these charts interesting beyond the potential pressure that rising rates might have on the economy is that the picture is inconsistent with the fast flight to liquidity detailed here last December.Rather, rising Treasury yields would seem to be supportive of risk-on and perhaps even a continuation of the Operation Twist Rally and perhaps this means the 3% rule will fail to hold in the weeks ahead.
That being said, there are some pretty fierce looking Rising Wedges out there in equity index land that come in the context of fairly topped-out looking Ascending Trend Channels.
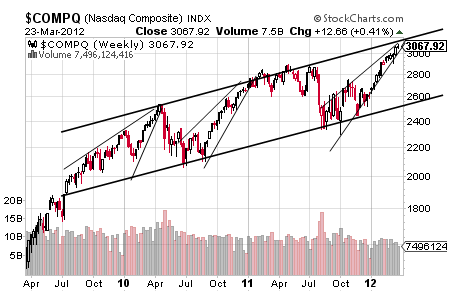
Should the equity indices correct by 20% or more on those technical aspects shown above in the Nasdaq Composite, it is hard to imagine that Treasury yields will rise unless it is a risk-off, US-off event with it being unclear where that cash might go if it is coming out of both traditional safe haven and risk asset classes at the same time unless, of course, it stays in cash for what would be a true flight to liquidity.
Something, then, is not quite adding up in looking at the long-term charts of Treasurys and the equity indices and it will be most interesting to see what gives in the end.
Until that loose piece is known, though, Treasury yields look set to keep rising.

Let’s look first at the short end with a long-term monthly chart of the 1-year yield showing a beautiful and bullish Falling Wedge pattern that is basically confirmed for its target of about 6.0%.
Will it succeed in taking the 1-year yield that high? Maybe but probably not and if it does it will take years and it will depend on this pattern remaining confirmed by staying above 0.125%.Should the 1-year yield remain above 0.125%, though, it probably makes more sense to watch a bottoming pattern that confirms at 0.22% for a target of about 0.36% and a level that would be consistent with the goals of Operation Twist.
One of the other goals of Operation Twist, however, was to keep the long end down in order to keep borrowing rates low for consumers and businesses alike and this goal may just not work out so well in looking at charts of the 10- and 30-year yields and the chart of TBT.

As can be seen in the chart of the 10-year yield, it is trading in what appears to be pretty well-defined Descending Trend Channel that is calling for a move toward its top trendline and something that is supported by a Double Bottom along with upside gaps. All in, it appears as though the 10-year yield could travel up to about 3.25% within a year to two years. Clearly, this would not keep help to keep mortgage rates and other borrowing rates at record lows, but it would help savers to some degree, but the net effect on a fragile economy must be considered and it would seem to be a potential negative that might help to keep the velocity of money at a record low even though it may not be have a tax-like effect in the way that rising gas prices do.
Turning to one of the more mangled charts out there, the 30-year yield looks set to rise up toward 4.25% in response to the potential target-like pull of the top trendline to a large Symmetrical Triangle.

Such a potential move up by the 30-year yield is helped by an unclosed gap at 4.12% along with a basically confirmed Double Bottom pattern that carries a target of 4.25% and these technical aspects would seem to suggest that borrowing costs could be on the rise as was the case with the possibly more important 10-year around those matters.
Lastly, let’s take a look at TBT and an inverse ETF to the long end and it appears to be on the rise in inverse to price.

Above $23 and a Rounding Bottom will confirm for a target of very roughly $28.50 and a level that is perfectly consistent with the top trendline level of that Descending Trend Channel.
What makes these charts interesting beyond the potential pressure that rising rates might have on the economy is that the picture is inconsistent with the fast flight to liquidity detailed here last December.Rather, rising Treasury yields would seem to be supportive of risk-on and perhaps even a continuation of the Operation Twist Rally and perhaps this means the 3% rule will fail to hold in the weeks ahead.
That being said, there are some pretty fierce looking Rising Wedges out there in equity index land that come in the context of fairly topped-out looking Ascending Trend Channels.

Should the equity indices correct by 20% or more on those technical aspects shown above in the Nasdaq Composite, it is hard to imagine that Treasury yields will rise unless it is a risk-off, US-off event with it being unclear where that cash might go if it is coming out of both traditional safe haven and risk asset classes at the same time unless, of course, it stays in cash for what would be a true flight to liquidity.
Something, then, is not quite adding up in looking at the long-term charts of Treasurys and the equity indices and it will be most interesting to see what gives in the end.
Until that loose piece is known, though, Treasury yields look set to keep rising.
