- Sentiment indicators have dropped since the first of the year.
- The latest GDP report was down.
- Export orders are off.
We're somewhere between five and six months into a new international trade paradigm. It started with a US threat to impose higher tariffs on steel and aluminum imports. This was followed by a round of inconclusive negotiations and the return imposition of retaliatory measures on US exports. The sanctions were formally imposed earlier last week to the consternation of US allies.
We've had about 4-5 months of EU data since this new trade situation emerged. While the region is holding up modestly well, business sentiment is starting to suffer and recent Q/Q GDP growth figures show further deterioration.
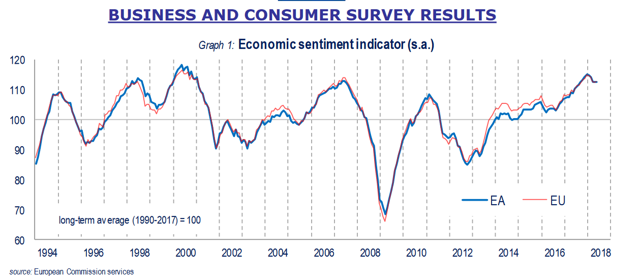
Let's start with the sentiment surveys from the European Commission:
EU sentiment started to increase in 2H16 and continued rising for all of 2017. But it dipped at the beginning of this year as news of the trade sanctions started to hit the wires.

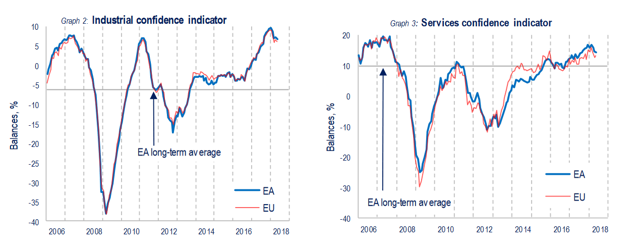
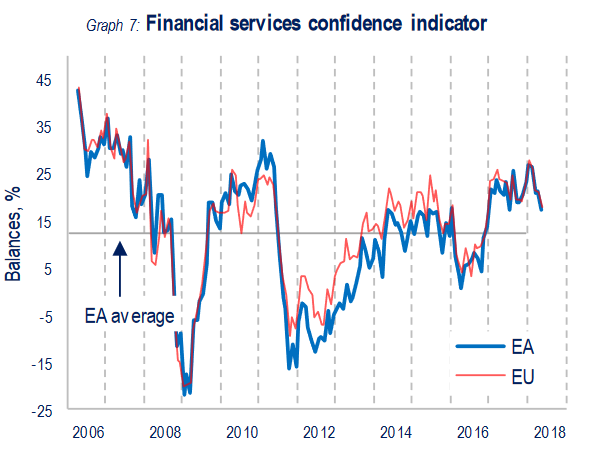
Both industrial confidence and service confidence have fallen, as has financial services sentiment:

Last week, the Eurostat released its latest estimate of EU GDP, which contained the following table:
The Financial Times reported the data as signaling a slowdown. The Q/Q growth rates are noticeably weaker. While consumer spending rose at a fairly strong clip, business investment (which was probably lower due to declining sentiment) was significantly weaker. And exports contracted, which is undoubtedly a result of more hostile trade environment. Imports - which are a sign of domestic demand - also contracted. Some of this is probably related to the weaker capital investment numbers, as manufacturers pare back their production schedules.
We're also starting to see some weakness in manufacturing data. Although the latest Markit Economics' reports all pointed towards continued manufacturing growth, Germany, France, and Italy all noted that export orders were weaker. Other country-level data is slower. The Financial Times recently reported that Germany factory orders were off 2.5% between April and May, marking the fourth straight decline. And French industrial production was off .5% in its latest release.
Finally, on the economic front, while retail sales are still in an uptrend, the latest report showed a weak .1% M/M increase. While German sales were up 2.5%, sales were down in Spain (-.7%) and France (-1.2%). At the time of the report, there was no information available from Italy.
Politically, the region has more than its fair share of issues. Not only is it feuding with the US but two of its largest economies are experiencing a certain level of political instability. Spain just ousted its Prime Minister over corruption charges. And it still has the ongoing issues in the Catalonia region. And Italy has had about a month of political drama related to the latest election.
We certainly aren't at a point of economic Armageddon. But there has been sufficient data to conclude that the increasing trade tensions are having a negative impact.
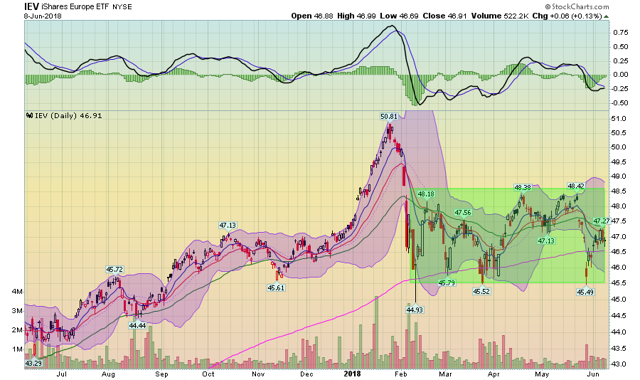
So, what does this mean for investing in the EU? To answer that question, let's take a look at the charts of the iShares Europe Fund (NYSE:IEV)—the ETF which contains a number of large-cap companies from across the largest EU equity market:
There are several points of note on the above daily chart. First, notice the sharp rally that lasted approximately 70% of January, only to see prices do a 100% round-trip within a short period of time. That mirrored the US market correction that occurred in the early spring.
Since then, prices for the IEV ETF have vacillated between 45.5 and 48.5 - a three-point range, which is certainly nothing to get excited about. Prices have used the 200-day EMA for technical support - a very standard development.
The short EMAs are currently in a "barbed-wire" configuration, which means they are intertwined with each other. In this situation (which actually occurs far more often than most technical analysts would care to admit) it's nearly impossible to discern any information from the shorter EMA. So, let's also take a look at the charts for the ETFs that represent each of the largest economies in the region—iShares MSCI Germany (NYSE:EWG), iShares MSCI Italy Capped (NYSE:EWI), iShares MSCI Spain Capped (NYSE:EWP), iShares MSCI France (NYSE:EWQ), iShares MSCI United Kingdom (NYSE:EWU) and of course the IEV.

The main country to worry about in this scenario is Germany because it is the country most responsible for the EU's trade surplus. The ETF that tracks the DAX (the main equity index for Germany) is in the upper left-hand corner of the above charts. It is very similar to the IEV ETF. The Italian ETF (top row, second from the left) recently dropped through support as did Spain's ETF (top row, second from the right). Both did so on account of domestic issues which exacerbated concerns inherent in each economy. The remaining ETFs are all similar to the IEV, which I analyzed above.
The best interpretation of the above charts is that traders are biding their time, waiting for better news to emerge. But with the combination of weaker economic data and internal political issues causing markets to fall through key and important technical levels, it's probably best to avoid this area of the equity markets until we have far better visibility and somewhat improving economic numbers.
Disclosure: I/we have no positions in any stocks mentioned, and no plans to initiate any positions within the next 72 hours.


