Last week, the Census Bureau, as part of their 2012 American Community Survey, published median income data for 2012. One question comes to mind: Is income tax widening the income gap which is slowing growth for the USA consumer driven economy?
This week we also published August 2013 median income data (which uses a slightly different methodology). This provides a similar conclusion – the median household is not getting richer.
Also, Friday’s personal income data reports that incomes continue to show a rise in per capita income (red line in figure 1). Yet, the median incomes (blue line) have been falling steadily since 2007. When averages are rising whilst medians fall, it says the poor are poorer, or the rich are richer – or in the current situation, both are occurring simultaneously.
Figure 1 – Real median income (blue line, left axis) versus Per capita real disposable income (red line, right axis)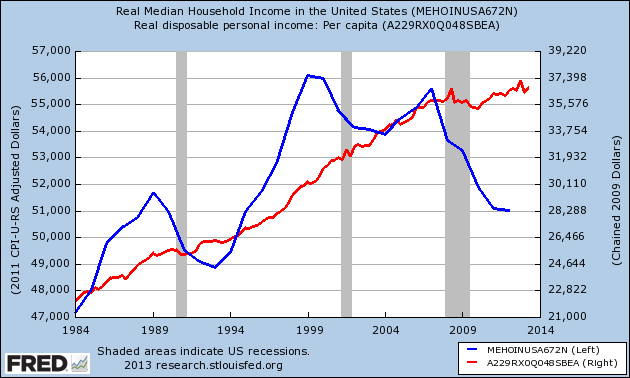
And the shift away from consumer based economy is confirmed from the falling share of the economy from wages (figure 2 – blue line).
Figure 2 – Wages portion of economy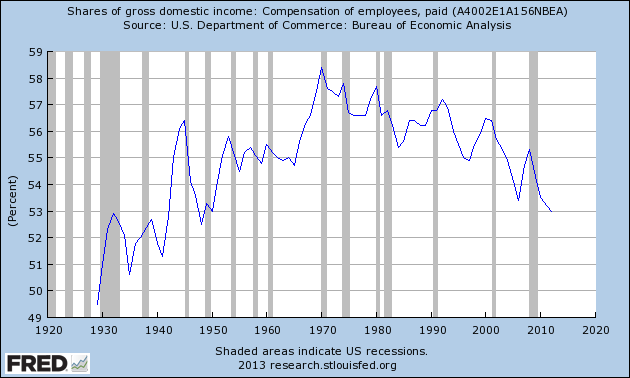
Could the tax codes could be partially to blame for the rich getting richer? The tax codes favor those who have non-employment income (as capital gains are taxed at lower levels), and can afford accountants and tax attorneys (aka 0.6%). [0.4% of taxpayers in in the $500k to $1 million strata plus the 0.2% in the $1 million plus strata = 0.6%]
It is one thing for someone (like me) to despise income redistribution, but it is quite another to have the tax codes take money from the lower end of the households when they are under duress.
However, there is no question the 0.6% contribute a disproportionately significant portion of the USA tax revenue.
Figure 3 – Breakdown by Income Strata by Type of Income (tax year 2011)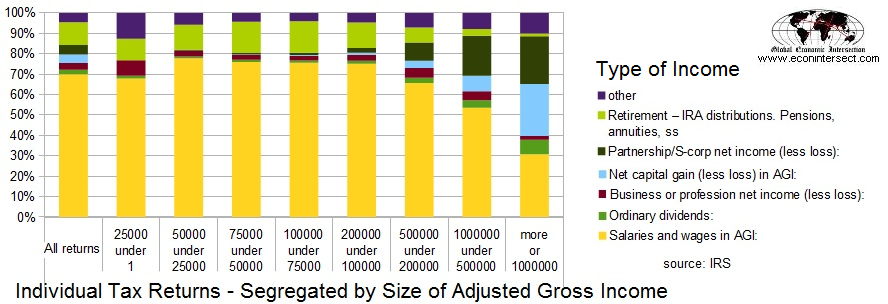
Table 1 – Average income and taxes paid per income strata (tax year 2011) – data from IRS
As shown in table 1, it is also true that the 0.6% pay a significantly higher proportion of their incomes in taxes. Progressive taxation does tax higher incomes more, but almost half the tax contributions to the government come from two stratas encompassing AGI’s between $100,000 and $500,000.
This is 2013 – and what we know about fiat currency operations tells us that, in general, taxing income is synonymous with blood letting. No tax system is fair for all – and if all state and local taxes as well as FICA is included, the USA has a very regressive tax system which severely taxes incomes under $100,000 compared to all higher incomes. Incomes below $40,000 get some relief when children are involved because of the earned income tax credits.
It also should be pointed out that the poverty level for a family of two is $15,510 (mixed government interpretation whether this is a before or post tax income). But it is illogical that the lower two income stratas should be paying 7% plus in income taxes.
The income tax system could be used to add additional income to the lower stratas by simply not taxing.
In any event, it is difficult to prove the tax codes per se are the proximate cause of the weakening of the middle class. Yet, the median family is in distress, and growing income disparity is dangerous in a democracy.
During the recent financial crisis, the government stepped in and supported banks to keep the economy from collapsing. At this point, it seems the median needs more money in their pockets to ease the decline in their income, and in the process help the economy.
Other Economic News this Week:
The Econintersect economic forecast for September 2013 improved but still shows the economy barely expanding. The concern is that consumers are spending a historically high amount of their income, and several non-financial indicators are weak.
The ECRI WLI growth index value has been weakly in positive territory for over four months – but in a noticeable improvement trend. The index is indicating the economy six month from today will be slightly better than it is today.
Current ECRI WLI Growth Index: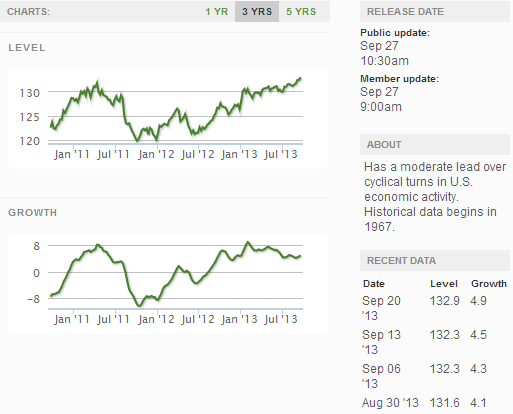
Initial unemployment claims went from 309,000 (reported last week) to 305,000 this week. Historically, claims exceeding 400,000 per week usually occur when employment gains are less than the workforce growth, resulting in an increasing unemployment rate.
The real gauge – the 4 week moving average – improved from 314,750 (reported last week) to 308,000. Because of the noise (week-to-week movements from abnormal events AND the backward revisions to previous weeks releases), the 4-week average remains the reliable gauge.
Weekly Initial Unemployment Claims – 4 Week Average – Seasonally Adjusted – 2011 (red line), 2012 (green line), 2013 (blue line)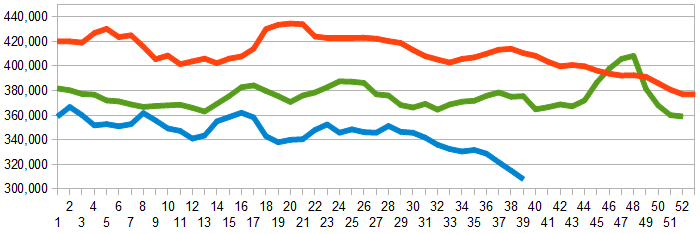
Bankruptcies this Week: Lone Pine Resources
Data released this week which contained economically intuitive components(forward looking) were:
- Rail movements growth trend is continuing to accelerate.
All other data released this week either does not have enough historical correlation to the economy to be considered intuitive, or is simply a coincident indicator to the economy.
Weekly Economic Release Scorecard:
Click here to view the scorecard table below with active hyperlinks
