I’ve recently been seeing a certain defense of equities that I think is interesting. It runs something like this:
The recent rise in interest rates, which helped cause the stock market swoon, is actually a good thing because interest rates are rising due to a strong economy and increasing demand for capital, which pushes up interest rates. Therefore, stocks should actually not mind the increase in interest rates because it’s an indication of a strong economy.
This is a seductive argument. It’s wrong, but it’s seductive. Not only wrong, in fact, but wrong in ways that really shouldn’t confuse any economist or strategist writing in the last twenty years.
Up until the late 1990s, we couldn’t really tell the main reason that nominal interest rates were rising or falling. For an increase in market rates there are two main potential causes: an increase in real interest rates, which can be good if that increase is being caused by an increasing demand for credit rather than by a decreasing supply, and an increase in inflation expectations, which is an unalloyed negative. But in 1995, we would have had to just guess which was causing the increase in interest rates.
But since 1997, we’ve had inflation-linked bonds, which trade on the basis of real yield. So we no longer have to guess why nominal rates are rising. We can simply look.
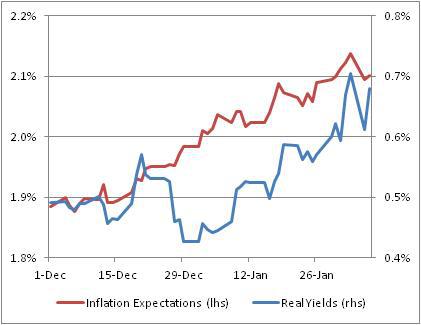
The chart below shows the decomposition of 10-year nominal yields since early December. The red line, which corresponds to the left scale, shows “breakevens,” or the simple difference between real yields and nominal yields; the blue line, on the right-hand scale, shows real yields. So if you combine the two lines at any point, you get nominal yields.

Real yields represent the actual supply and demand for the use of capital. That is, if I lend the government money for ten years, then in order to entice me to forego current consumption the government must promise that every year I will accumulate about 0.68% more ‘stuff.’ I can consume more in the future by not consuming as much now. To turn that into a nominal yield, I then have to add some premium to represent how much the dollars I will get back in the future, and which I will use to buy that ‘stuff’, will have declined in value. That of course is inflation expectations, and right now investors who lend to the government are using about 2.1% as their measure of the rate of deterioration of the value of the dollar.[1]
So, can we say from this chart that interest rates are mainly rising for “good” reasons? On the contrary! The increase in inflation expectations has been much steadier; only in the last month have real interest rates risen (and we don’t know, by the way, whether they’re even rising because of credit demand, rather than credit supply). Moreover – although you cannot see this from the chart, I can tell you based on proprietary Enduring Intellectual Properties research that at this level of yields, real yields are usually responsible for almost all of the increase or decrease in nominal yields.[2] So the fact that real yields are providing a little less than half of the selloff? That doesn’t support the pleasant notion of a ‘good’ bond selloff at all.
As I write this, we are approaching the equity market close. For most of the day, equities have been trading a bit above or a bit below around Monday’s closing level. While this beats the heck out of where they were trading overnight, it is a pretty feeble technical response. If you are bullish, you would like to see price reject that level as buyers flood in. But instead, there was pretty solid volume at this lower level. That is more a bearish sign than a bullish sign. However, given the large move on Friday and Monday it was unlikely that we would close near unchanged – so the last-hour move was either going to be significantly up or significantly down. Investors chose up, which is good news. But the bad news is that the end-of-day rally never took us above the bounce-high from Monday’s last hour, and was on relatively weak volume…and I also notice that energy prices have not similarly rallied.
[1] In an article last week I explained why we tend to want to use inflation swaps rather than breakevens to measure inflation expectations, but in this case I want to have the two pieces add up to nominal Treasury yields so I am stuck with breakevens. As I noted in that article, the 2.1% understates what actual inflation expectations are for 10 years.
[2] TIPS traders would say “the yield beta between TIPS and nominals is about 1.0.”
