Are interest rates too high stimulate the economy? Your initial reaction is likely that with the Federal Reserves' current zero interest rate policy interest rates cannot go any lower.
Follow up:
Hoisington Investment Management 2Q 2014 Review and Outlook stated:
.... Knut Wicksell (1851-1926) noted that the natural rate of interest, a level that does not tend to slow or accelerate economic activity, should approximate the growth rate of nominal GDP. Interest rates higher than the top-line growth rate of the economy, which is the case today, would mean that resources from the income stream of the economy would be required to pay for the higher rate of interest, thus slowing the economy. Wicksell preferred to use, not a risk free rate of interest such as thirty-year treasury bonds, but a business rate of interest such as BAA corporates.
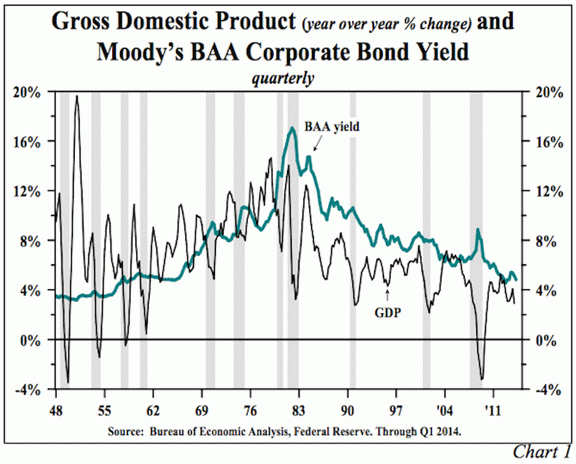
As chart one attests, interest rates below nominal GDP growth helps to accelerate economic activity and vice versa. Currently the higher interest rates are retarding economic growth, suggesting the next move in interest rates is lower.
To put the 2.9% change in nominal GDP over the past four quarters in perspective, it is below the entry point of any post-war recession. Even adjusting for inflation the average four-quarter growth rate in real GDP for this recovery is 1.8%, well below the 4.2% average in all of the previous post-war expansions.
It was the graph which caught my eye - as it did not prove to me that "interest rates below nominal GDP growth helps to accelerate economic activity and vice versa", although that is a general broad generalization of the correlation displayed. I guess that is what I was supposed to see: Prior to 1980 GDP was trending up while bond rates generally below GDP.
What I did see was that interest rates and inflation (often weakly) correlated to GDP in certain periods of time. What my eyeball scan picked up were the following possible correlations (call them short-term, if you will, as opposed to the longer-term trend correlations):
- 1948 to mid 1960s: No significant correlation
- 1970s: Significant negative correlation
- Early 1980s: Positive correlation
- Late 1980s to early 1990s: Negative correlation
- Mid 1990s to early 2000s: Positive correlation
- Mid 2000s to 2011: Negative correlation
- Now: Positive correlation
One has to wonder: Is there any significance to the alternation pattern of correlation? These are my eyeball impressions, subject to correction should someone go to the source data and actually calculate the correlation coefficients on a timeline. The graph below shows the net result of bonds less GDP.
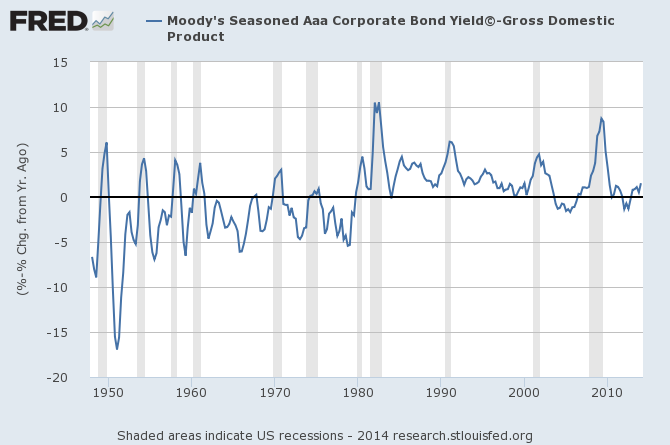
I am far from a theorist, but someone who likes to see what data tells you. I believe everyone runs a high risk of being wrong by presuming theories are always correct. This is true in hard sciences, and especially is true in human dynamics and economics. One always need to keep theories at the forefront, then continually and OBJECTIVELY test the theories against the data. I find that most people have already made up their mind that the theories they believe in are correct, and data to the contrary is always manipulated by the dark side.
The the graph below uses a different version of GDP - one that is adjusted for inflation so that one can see what are the real effect of bond rates on inflation adjusted GDP. Viewing the graph below, it is easier to see the trend lines. If correlations existed, they would be evident in the trends.
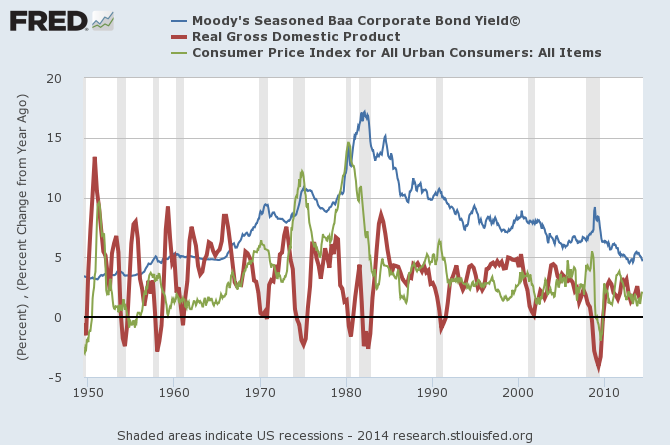
Picture the trend lines between real GDP (red line) and bond rates (blue line). Prior to 1980, the bond rate trended up while GDP trended down. After 1980, both real GDP and bonds trended down. This "proves" to me that the bond rate likely is not a significant longer-term driver in pushing GDP higher or lower - but seems to be only a supporting character at times in this drama. Are significant clues in the short-term correlation patterns? Maybe yes and maybe not - that question is beyond the scope of this post.
Single litmus test discussions (such as low interest rates stimulate the economy) are dangerous as many factors are at play. And today, we have the Federal Reserves' zero interest rate policy artificially "stimulating" the economy. Most economic theories are based on free movement of dynamics - artificially pegging an economic element likely throws a monkey wrench into economic theory, especially when the theory may not have the strongest quantitative support in empirical fact. And the Great Moderation caused by a more militant Federal Reserves monetary policy may explain why the bond rate has been generally above GDP growth since 1980.
All that being said, Hoisington Management has one of the industry's best records in fixed income investment returns. The discussion here should not be interpreted as challenging time-proven results - I perceive their article to be a discussion of a particular set of empirical parameters rather than a complete dump of their investing logic. Consider that the bond rates are currently trending down - and what Hoisington may be saying is that they expect this trend to continue until it is below nominal GDP growth.
Other Economic News this Week:
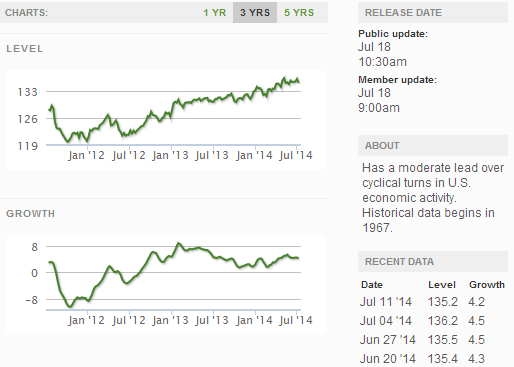
The Econintersect Economic Index for July 2014 is showing continued growth acceleration. Outside of our economic forecast - we are worried about the consumers' ability to expand consumption because the ratio between income and expenditures continues near all time highs. The GDP contraction for 1Q2014 is a paper contraction as GDP is determined by playing games with accounts. For 2Q2014 GDP, the trade balance will be a serious headwind.
The ECRI WLI growth index value has been weakly in positive territory for many months - but now in a noticeable improvement trend. The index is indicating the economy six month from today will be slightly better than it is today.
Current ECRI WLI Growth Index
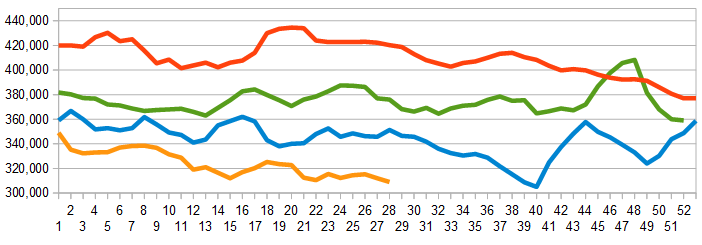
The market was expecting the weekly initial unemployment claims at 300,000 to 325,000 (consensus 310,000) vs the 302,000 reported. The more important (because of the volatility in the weekly reported claims and seasonality errors in adjusting the data) 4 week moving average moved from 312,000 (reported last week as 311,500) to 309,000.
Weekly Initial Unemployment Claims - 4 Week Average - Seasonally Adjusted - 2011 (red line), 2012 (green line), 2013 (blue line), 2014 (orange line)
Bankruptcies this Week: Canada-based Essar Steel Algoma
Click here to view the scorecard table below with active hyperlinks
