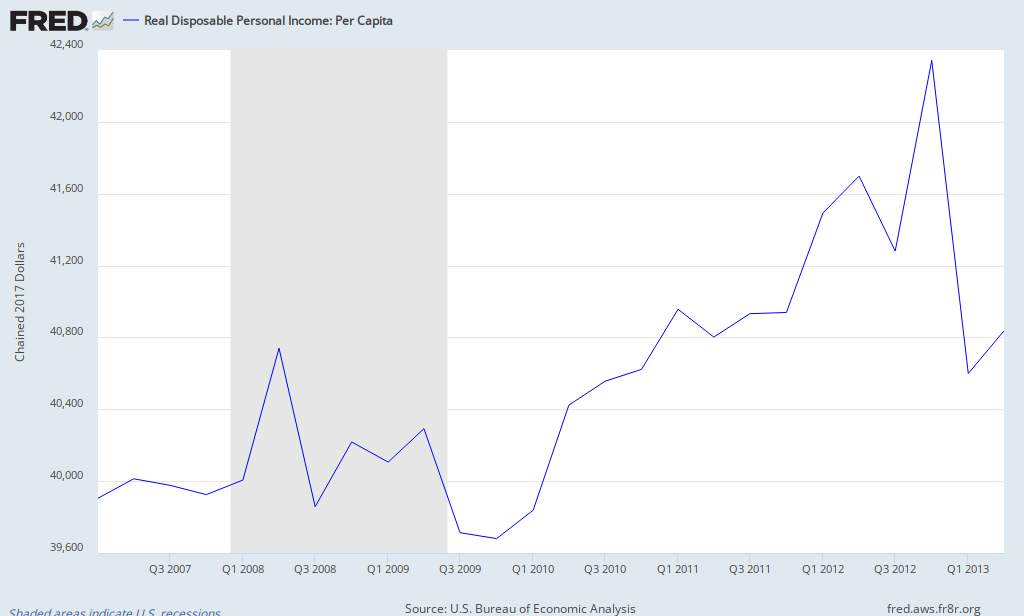
For a consumption based economy to grow, the median family spending money must continue to grow. The disposable income headlines misleadingly infer income is growing.
There are facts, and then there are facts. The headline numbers from the U.S. Census, Bureau of Labor Statistics and Bureau of Economic Analysis are either gross numbers for the entire economy or the gross number divided by the population (per capita). When you view this headline data, either you believe the average person is doing better – or you feel the government is lying because you and everyone around you are worse off.
Chart 1 – Per Capita Real Disposable Income.. 
In a consumption based economy, the amount of money in the hands of the consumer is the economic driver. If consumers are flooded with money, often they will buy the best car. If the consumers are poor, they will buy the cheapest car and only when necessary.
As background to what I am arguing, Econintersect published a Sentier Research summary study which showed Household Income Down by 4.4% Overall Post Recession. This post is based on supplemental data provided to Econintersect from Sentier Research LLC.
Here is where median income is important as we are looking at the income of the 50th percentile consumer. Watching the income of the 50th percentile tells you about the affordability of refrigerators to the 50th percentile consumer. Figure 1 below shows median income (red line, Figure 1) is declining while headline per capita (Chart 1 above) increases. 
One of the larger surprises in the data related to factors based on education. Growth in number of households varied with education; households with some college increased, while households with no college decreased.
Yet, earnings in all educational groups declined. Below are the current median incomes:
- not a high school graduate = $24,448.
- high school graduate (including equivalency) = $39,282.
- some college but no degree = $46,572.
- Associate degree = $56,390.
- Bachelor’s degree or more=$84,705.

Now consider that the cost of education has increased well over 15% since the end of the Great Recession, and also a recent graduate makes less than the median.
Chart 2 – Change in Cost of Education Since the End of the Great Recession

The average cost of a 4 year university (tuition, room and board) is over $21,000. I do not believe a university degree is a good investment for many. However, there are opposing views:
One common recommendation is that citizens should invest more in their education. Spurred by growing demand for workers performing abstract job tasks, the payoff for college and professional degrees has soared; despite its formidable price tag, higher education has perhaps never been a better investment.
In any event, one needs to be concerned with the decay of median income. The data points to the 1% distorting the per capita data and headlines while everyone else is losing ground.
Other Economic News this Week:
The Econintersect economic forecast for September 2013 improved but still shows the economy barely expanding. The concern is that consumers are spending a historically high amount of their income, and several non-financial indicators are weak.
The ECRI WLI growth index value has been weakly in positive territory for over four months – but in a noticeable improvement trend. The index is indicating the economy six month from today will be slightly better than it is today.
Current ECRI WLI Growth Index

Initial unemployment claims went from 336,000 (reported last week) to 331,000 this week. Historically, claims exceeding 400,000 per week usually occur when employment gains are less than the workforce growth, resulting in an increasing unemployment rate.
The real gauge – the 4 week moving average – degraded slightly from 330,500 (reported last week) to 331,250. Because of the noise (week-to-week movements from abnormal events AND the backward revisions to previous weeks releases), the 4-week average remains the reliable gauge.
Weekly Initial Unemployment Claims – 4 Week Average – Seasonally Adjusted – 2011 (red line), 2012 (green line), 2013 (blue line)

Bankruptcies this Week: Xtreme Green Products
Data released this week which contained economically intuitive components(forward looking) were:
- Rail movements growth trend is currently accelerating – except for the 4 week rolling average.
- Read disposable personal income improved – but growth remains well under expenditures.
Weekly Economic Release Scorecard:
Click here to view the scorecard table below with active hyperlinks

