Are government bonds creating a peak and starting to roll over? Possible!
What happens at the support test (2) will go a long way to answering this question.
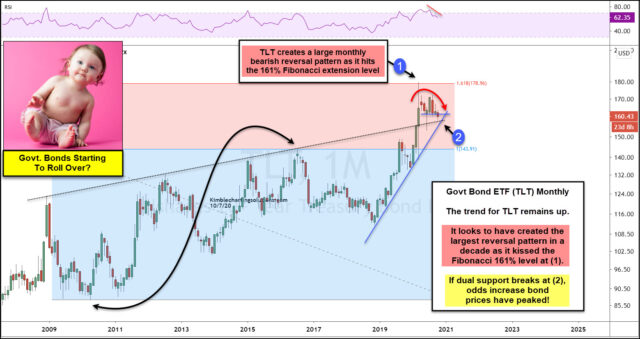
This chart looks at Government Bond ETF (NASDAQ:TLT) on a monthly basis, where Fibonacci was applied to the 2010 lows and 2016 highs.
TLT hit the Fibonacci 161% extension level, where it created the largest monthly reversal pattern in the past couple of decades!
Since creating the large reversal pattern in 20 years, with momentum the highest in a decade, TLT has started to create a series of lower monthly highs.
The weakness over the past six months has TLT nearing dual support at (2).
If this support fails to hold, it would suggest that an intermediate high in bond prices has taken place and TBF (NYSE:TBF) (inverse bond etf) should rally in price.
