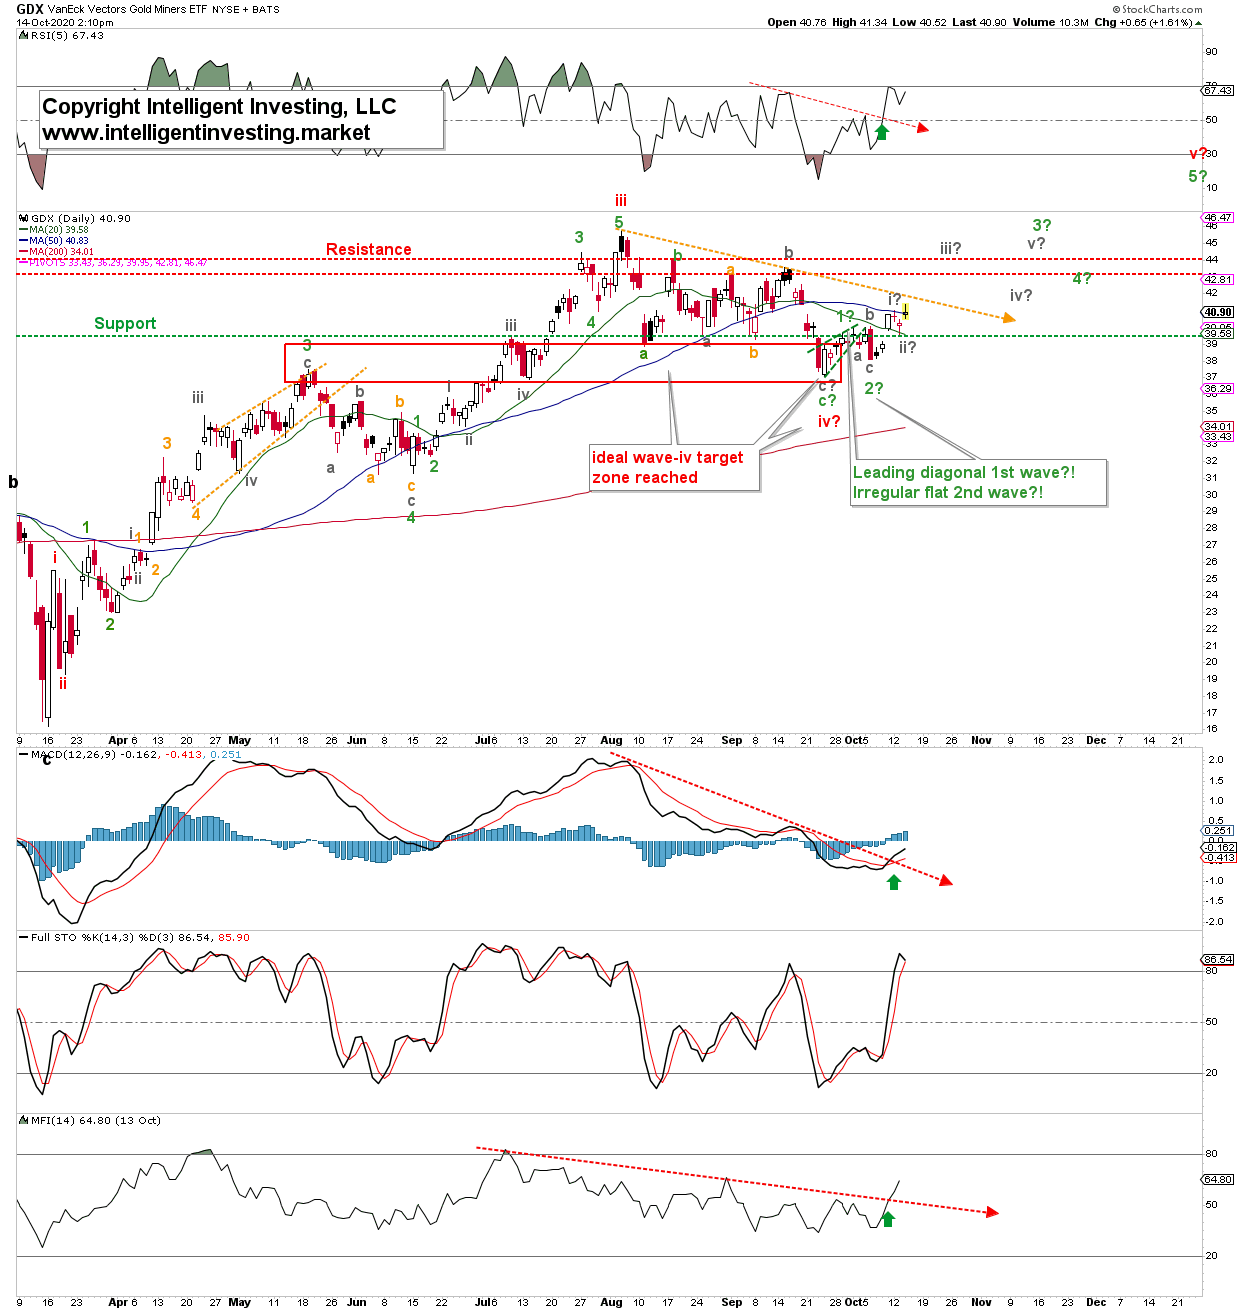
The VanEck Vectors Gold Miners ETF (NYSE:GDX) has been rallying – like the major U.S. stock market indexes – since the infamous March low. GDX, however, topped out in early August and has since been slowly grinding lower in what appears as overlapping price action. In Elliott Wave (EW) terms, overlapping downward price action means it is a correction of a dominant upward trend. The correction will eventually end as the uptrend resumes.
Early October I already informed my Premium Metals, Miners and USD members the continuation of the uptrend could have started from the late-September low, as the instrument bottomed right in the ideal red wave-iv targets zone. Since, it possibly did a leading diagonal first wave (green 1?), then an irregular flat wave-2 (green 2?). Now, it could be in the starting gates of (grey) wave-iii of (green) wave-3: a third of a third wave. The money-maker.
The labels in Figure 1, below, show the ideal anticipated impulse move higher and where each subsequent wave should ideally top and bottom assuming standard Fibonacci extensions and retraces for each wave. Thus, GDX can reach as high as $49-50 from current levels. A ~20% upside reward.
Figure 1.

From a technical perspective, the daily RSI5, MACD and Money Flow Index all broke above their downtrend lines (red dotted arrows) in place during the entire correction. Such breakouts add weight to the evidence the correction is over and supports the bullish EW count as shown. The latter indicator is IMHO important since liquidity drives markets and money is flowing back into the ETF. Besides, GDX is trying to break back above its 50-day Simple Moving Average (50d SMA), while already above its 20d and 200d SMA. Hence, the short- and long-term trend remain up. If the 50d SMA can hold, then the intermediate-term trend is back to up. All then add weight to the bullish evidence. Thus, as long as the instrument can stay above the recent green wave-2 low made on Oct. 7 at $38.15, then the bullish EW count as shown remains in play. In turn, there is at current prices a 6.5% downside risk. The risk/reward is thus 6.5 to 20. 1 to 3. In my humble opinion, a great ratio for a long entry. In fact, on my private twitter trading feed we are already long GDX since last week. Of course, the appropriate stops are in place, but I do put my money where my mouth is.
For now, I really would like to see GDX close back above its 50d SMA, and then the orange downtrend line, to add more certainty to the bullish option shown. If it cannot and it closes below yesterday’s low going forward, then that is a serious warning for the bulls that the continuation of the uptrend is likely delayed.
