Precious metals mining stocks may not look too encouraging of late, with mostly declines in 2013 and a lack of any spectacular rally. But other influential markets suggest that the situation is likely to change in the near future – the underlying metals seem poised to rally, the general stock market is rallying and the dollar is in a long-term downtrend. It is still hard to answer the key question, however, as the above factors do not provide any crystal-clear signals. Let us then move on to the technical part of today’s essay to see if the charts can tell us more – we’ll begin with the analysis of the junior gold and silver stocks.
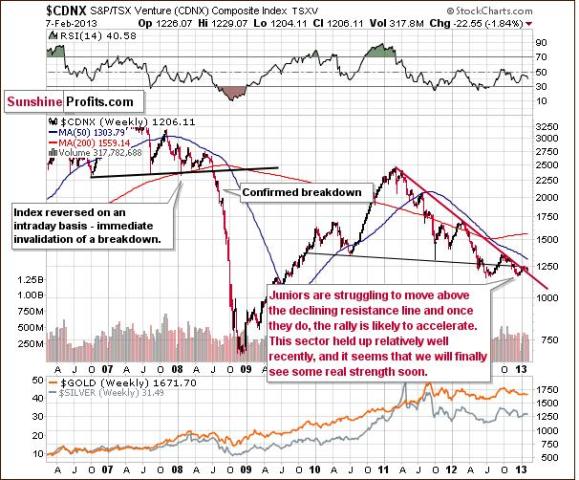
In the Toronto Stock Exchange Venture Index (which is a proxy for the junior miners as so many of them are included in it), the Junior’s sector did not do much this week as sideways trading was seen, and price levels are now close to the declining resistance line. No significant breakout has been seen yet, but one is likely once additional strength is seen in the precious metals. This will probably lead to a continuation of the rally, and little else needs to be said. We expect prices to move to the upside here as well.
Let us have a look at gold senior miners now, with GDX ETF serving as a proxy. 
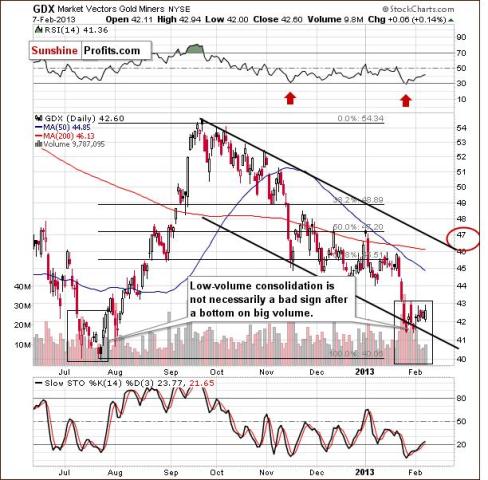
In this week’s GDX ETF chart, not much has changed on a medium-term basis. A short-term rally was seen on Thursday, but with accompanying low volume levels, it is unclear if this is a bullish sign or not. In the previous similar case when mining stocks were heavily oversold on a short-term basis after a big decline, and after a bottom following a huge decline, low volume seen during the rallies which followed was not necessarily bearish. Higher prices continued and a big rally was seen following as well. Note that it did not happen immediately - one more move to the previous low was seen; maybe this is what we saw on Monday.
Our final chart for today features gold miners to gold ratio.
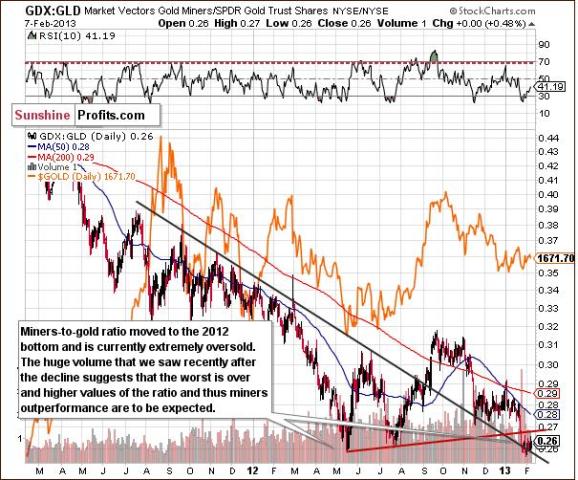
In today’s miners to gold ratio chart, little change was seen, and the ratio is still close to the 2012 low, which is a major support level. It will probably not move below this level as it seems the damage has already been done, and recent high volume levels confirm it.
Since many of our readers are concerned about the state of gold and silver stocks, we would like to quote two of your questions regarding the precious metals market that were answered (along with many other ones in the last Premium Update). Both of them have to do with technical patterns.
Q: I have ONE major concern. The gigantic Head and Shoulders in the HUI since 2009 with the Right Shoulder now formed and a neckline at about 375-80. If that breaks, don’t we see a fast 100-150 on the HUI? Isn’t that a scary chart? I would greatly appreciate an answer on this because I am seriously considering selling a lot of my stocks in gold and silver based on that alone. The CDNX chart looks very scary also.
A: The head of this pattern would be very large compared to the shoulders, meaning that this formation is not very reliable. Also, if we use the 2012 low as the neck level (approximately), then the HUI Index is still considerably above it, so this formation is not in place, at least not yet. Therefore, it doesn't have bearish implications. The breakdown below the 2012 low (close to the 370 level in the HUI Index) would be a very bearish technical factor, if confirmed. However, we don't think that such a breakdown is in the cards in the coming weeks.
As far as CDNX (Toronto Stock Exchange Venture Index) is concerned, we don't view this chart as bearish, as a small rally here will mean a major breakout that will likely result in much bigger rallies.
Q: Hello P.R. doesn’t this seem like a bearish flag: Slow grind higher in miners on low volume after big declines. What should we be looking for if this is actually the bottom?
Should the move up be bigger and on higher volume? I don’t know anything, just wondering. Every time there seems to be a break after a big decline, the decline returns with a vengeance. How is this different?
A: Generally yes, we would like to see a strong rally on strong volume to be more confident that the final bottom is behind us. The price pattern in mining stocks does look like a bearish flag pattern that would result in the continuation of the decline. However, we will not know until the miners break out either above the flag or below it. The key point here is that other markets - gold, silver, platinum - suggest higher prices in our view, and the SP Indicators suggest higher prices as well. The situation in the USD Index is also favorable. As no market moves totally on its own, we take more of them into account, and in this case the results are bullish.
Summing up, the situation in the gold and silver mining stocks is not encouraging for the short term, but taking the long-term valuation into account, as well as the other precious metals markets and related signals, expecting higher mining stocks’ prices still makes sense.
- English (UK)
- English (India)
- English (Canada)
- English (Australia)
- English (South Africa)
- English (Philippines)
- English (Nigeria)
- Deutsch
- Español (España)
- Español (México)
- Français
- Italiano
- Nederlands
- Português (Portugal)
- Polski
- Português (Brasil)
- Русский
- Türkçe
- العربية
- Ελληνικά
- Svenska
- Suomi
- עברית
- 日本語
- 한국어
- 简体中文
- 繁體中文
- Bahasa Indonesia
- Bahasa Melayu
- ไทย
- Tiếng Việt
- हिंदी
Are Gold And Silver Stocks Ready For A Rally Yet?
Published 02/13/2013, 05:01 AM
Updated 05/14/2017, 06:45 AM
Are Gold And Silver Stocks Ready For A Rally Yet?
Latest comments
Loading next article…
Install Our App
Risk Disclosure: Trading in financial instruments and/or cryptocurrencies involves high risks including the risk of losing some, or all, of your investment amount, and may not be suitable for all investors. Prices of cryptocurrencies are extremely volatile and may be affected by external factors such as financial, regulatory or political events. Trading on margin increases the financial risks.
Before deciding to trade in financial instrument or cryptocurrencies you should be fully informed of the risks and costs associated with trading the financial markets, carefully consider your investment objectives, level of experience, and risk appetite, and seek professional advice where needed.
Fusion Media would like to remind you that the data contained in this website is not necessarily real-time nor accurate. The data and prices on the website are not necessarily provided by any market or exchange, but may be provided by market makers, and so prices may not be accurate and may differ from the actual price at any given market, meaning prices are indicative and not appropriate for trading purposes. Fusion Media and any provider of the data contained in this website will not accept liability for any loss or damage as a result of your trading, or your reliance on the information contained within this website.
It is prohibited to use, store, reproduce, display, modify, transmit or distribute the data contained in this website without the explicit prior written permission of Fusion Media and/or the data provider. All intellectual property rights are reserved by the providers and/or the exchange providing the data contained in this website.
Fusion Media may be compensated by the advertisers that appear on the website, based on your interaction with the advertisements or advertisers.
© 2007-2025 - Fusion Media Limited. All Rights Reserved.
