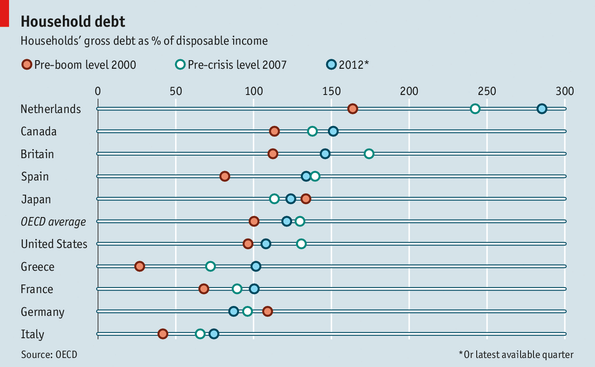
Is personal debt restraining economic expansion? Many pundits talk about the debt unwinding cycle not being complete from the Great Recession. Is there some magic formula for deciding if debt levels are too high and need unwinding? Is there historical data which supports a certain debt level being optimum? Total household debt is shown as over 120% of GDP which seems like a large number (and is larger than several advanced economies).
Follow up:
Consider that the size of USA household debt is within the range of the Eurozone countries.
Consumer or household debt is an important topic for the USA economy as it is much more consumer driven than Asia or Europe.
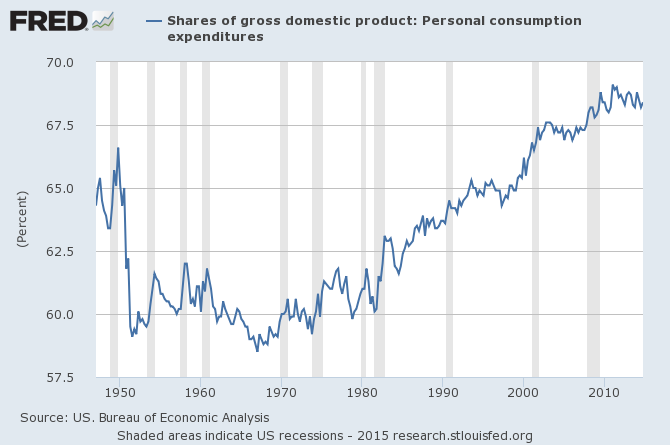
From the mid-1960s to the Great Recession, the consumer's share of the USA economy increased. Since the end of the Great Recession, consumers portion of the economy has remained in a tight range. To put framework on the discussion of debt - debt is described in various terms:
- total household debt
- mortgage debt
- consumer debt (total household debt less mortgage debt)
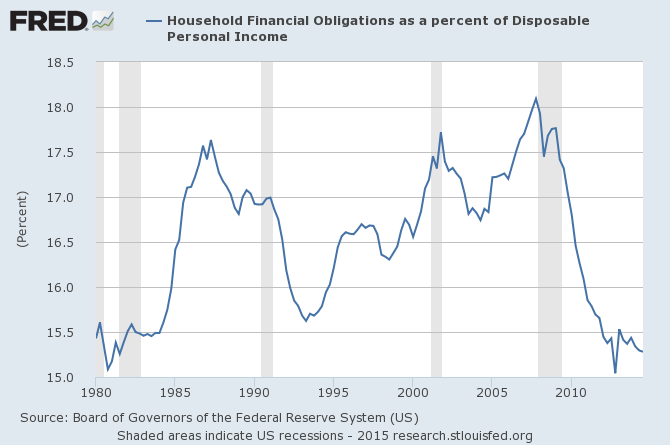
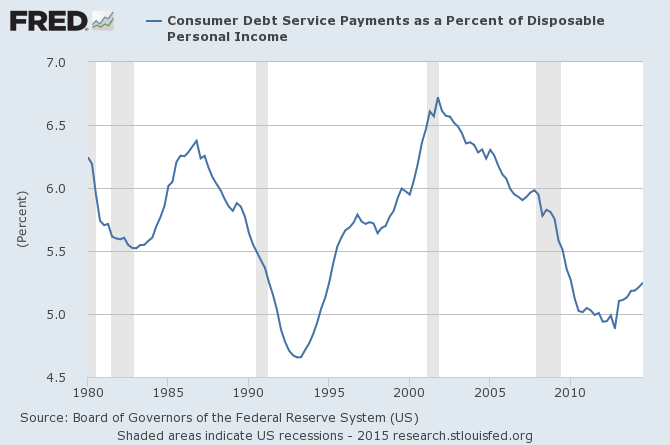
Because of very low interest rates, repayments of existing loans are taking a smaller and smaller portion of household income - and near historical lows.
Consumer debt, even though requiring a historically small portion of income to service (re-pay), is now growing.
Graphically most pundits toss out the total household debt graphs to "prove" there is a debt problem.
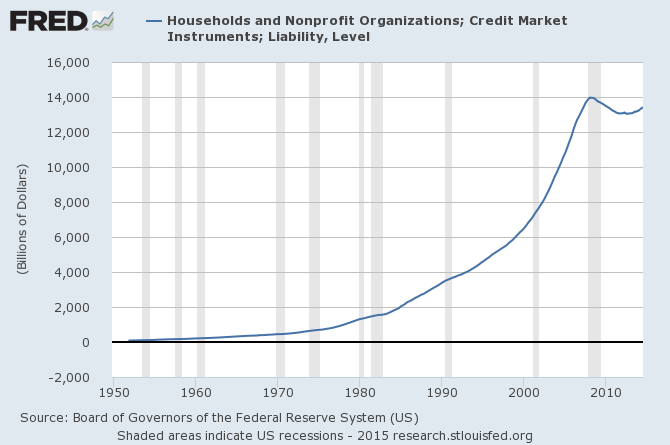
However, there is a difference between mortgage debt and consumer debt - and the way one views these "debts" should be different. Mortgage debt is on an asset which generally does not depreciate in value (exceptions are the two depressions - the years leading up to and including Great Depression and the Great Recession). Further, mortgage debt is long term and generally proximates the household spending one would have if one rented rather than purchased their primary residence. Although mortgages are considered debt, they could be described as a long term lease obligation where at the end of the day you own your home.
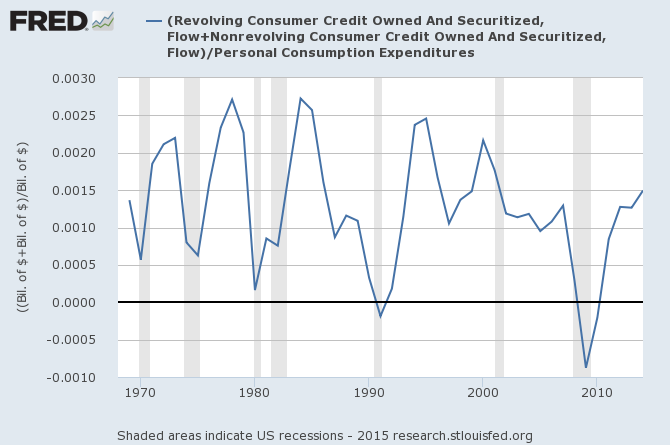
Consumer debt (car loans, credit cards, and student loans) is on products and services which have no secured value after a period of time. A way to look at consumer debt (instead of looking at total debt outstanding) is to look at monetary flows into new consumer debt - which currently appear to be at the average level which has been seen since the 1970s.
Mortgage debt levels continue to fall because of foreclosures and refinancing of existing loans. The graph below shows the ratio between mortgage debt and income which is currently 1.06 (or saying it another way, total mortgage debt is 106% of yearly disposable personal income).
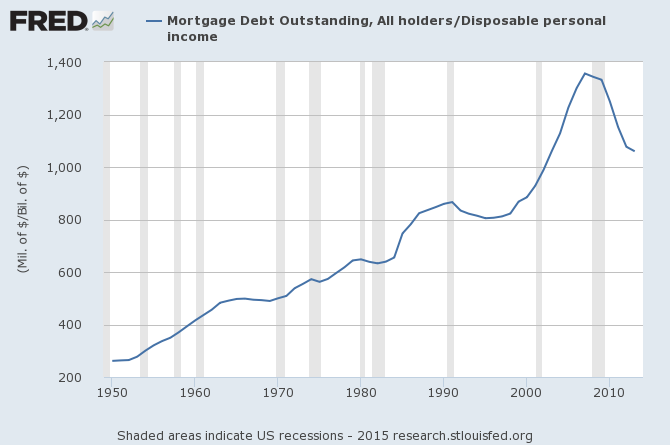
The USA is spending less than 20% of household income on mortgages - and is the lowest of any advanced economy. Mortgages are approximately 85% of total household debt. This debt is long term and on a real asset that (usually) relatively holds its value - and is roughly equal to household spending on renting a residence. Households are spending a historically small portion of income on mortgage repayments. Therefore, one should not consider mortgage obligations if you were trying to establish whether the consumer was carrying too much debt.
Consumer debt (total debt less mortgages) - seems to be within "historical" boundaries. There is little evidence that "high" consumer debt levels could be restraining economic growth. Yet, consumption is lagging - and so is savings. Something (or some things) may be constraining consumer growth.
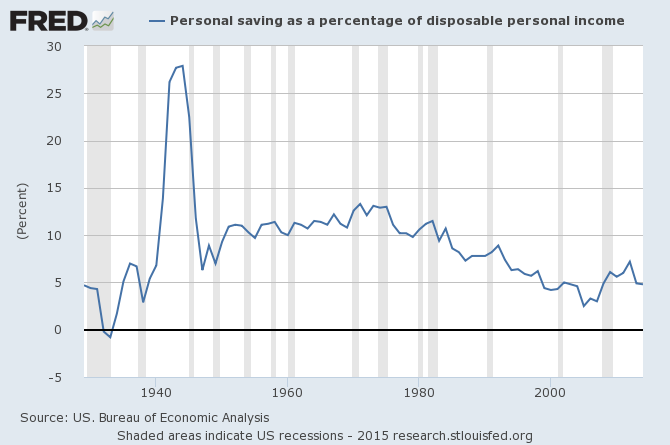
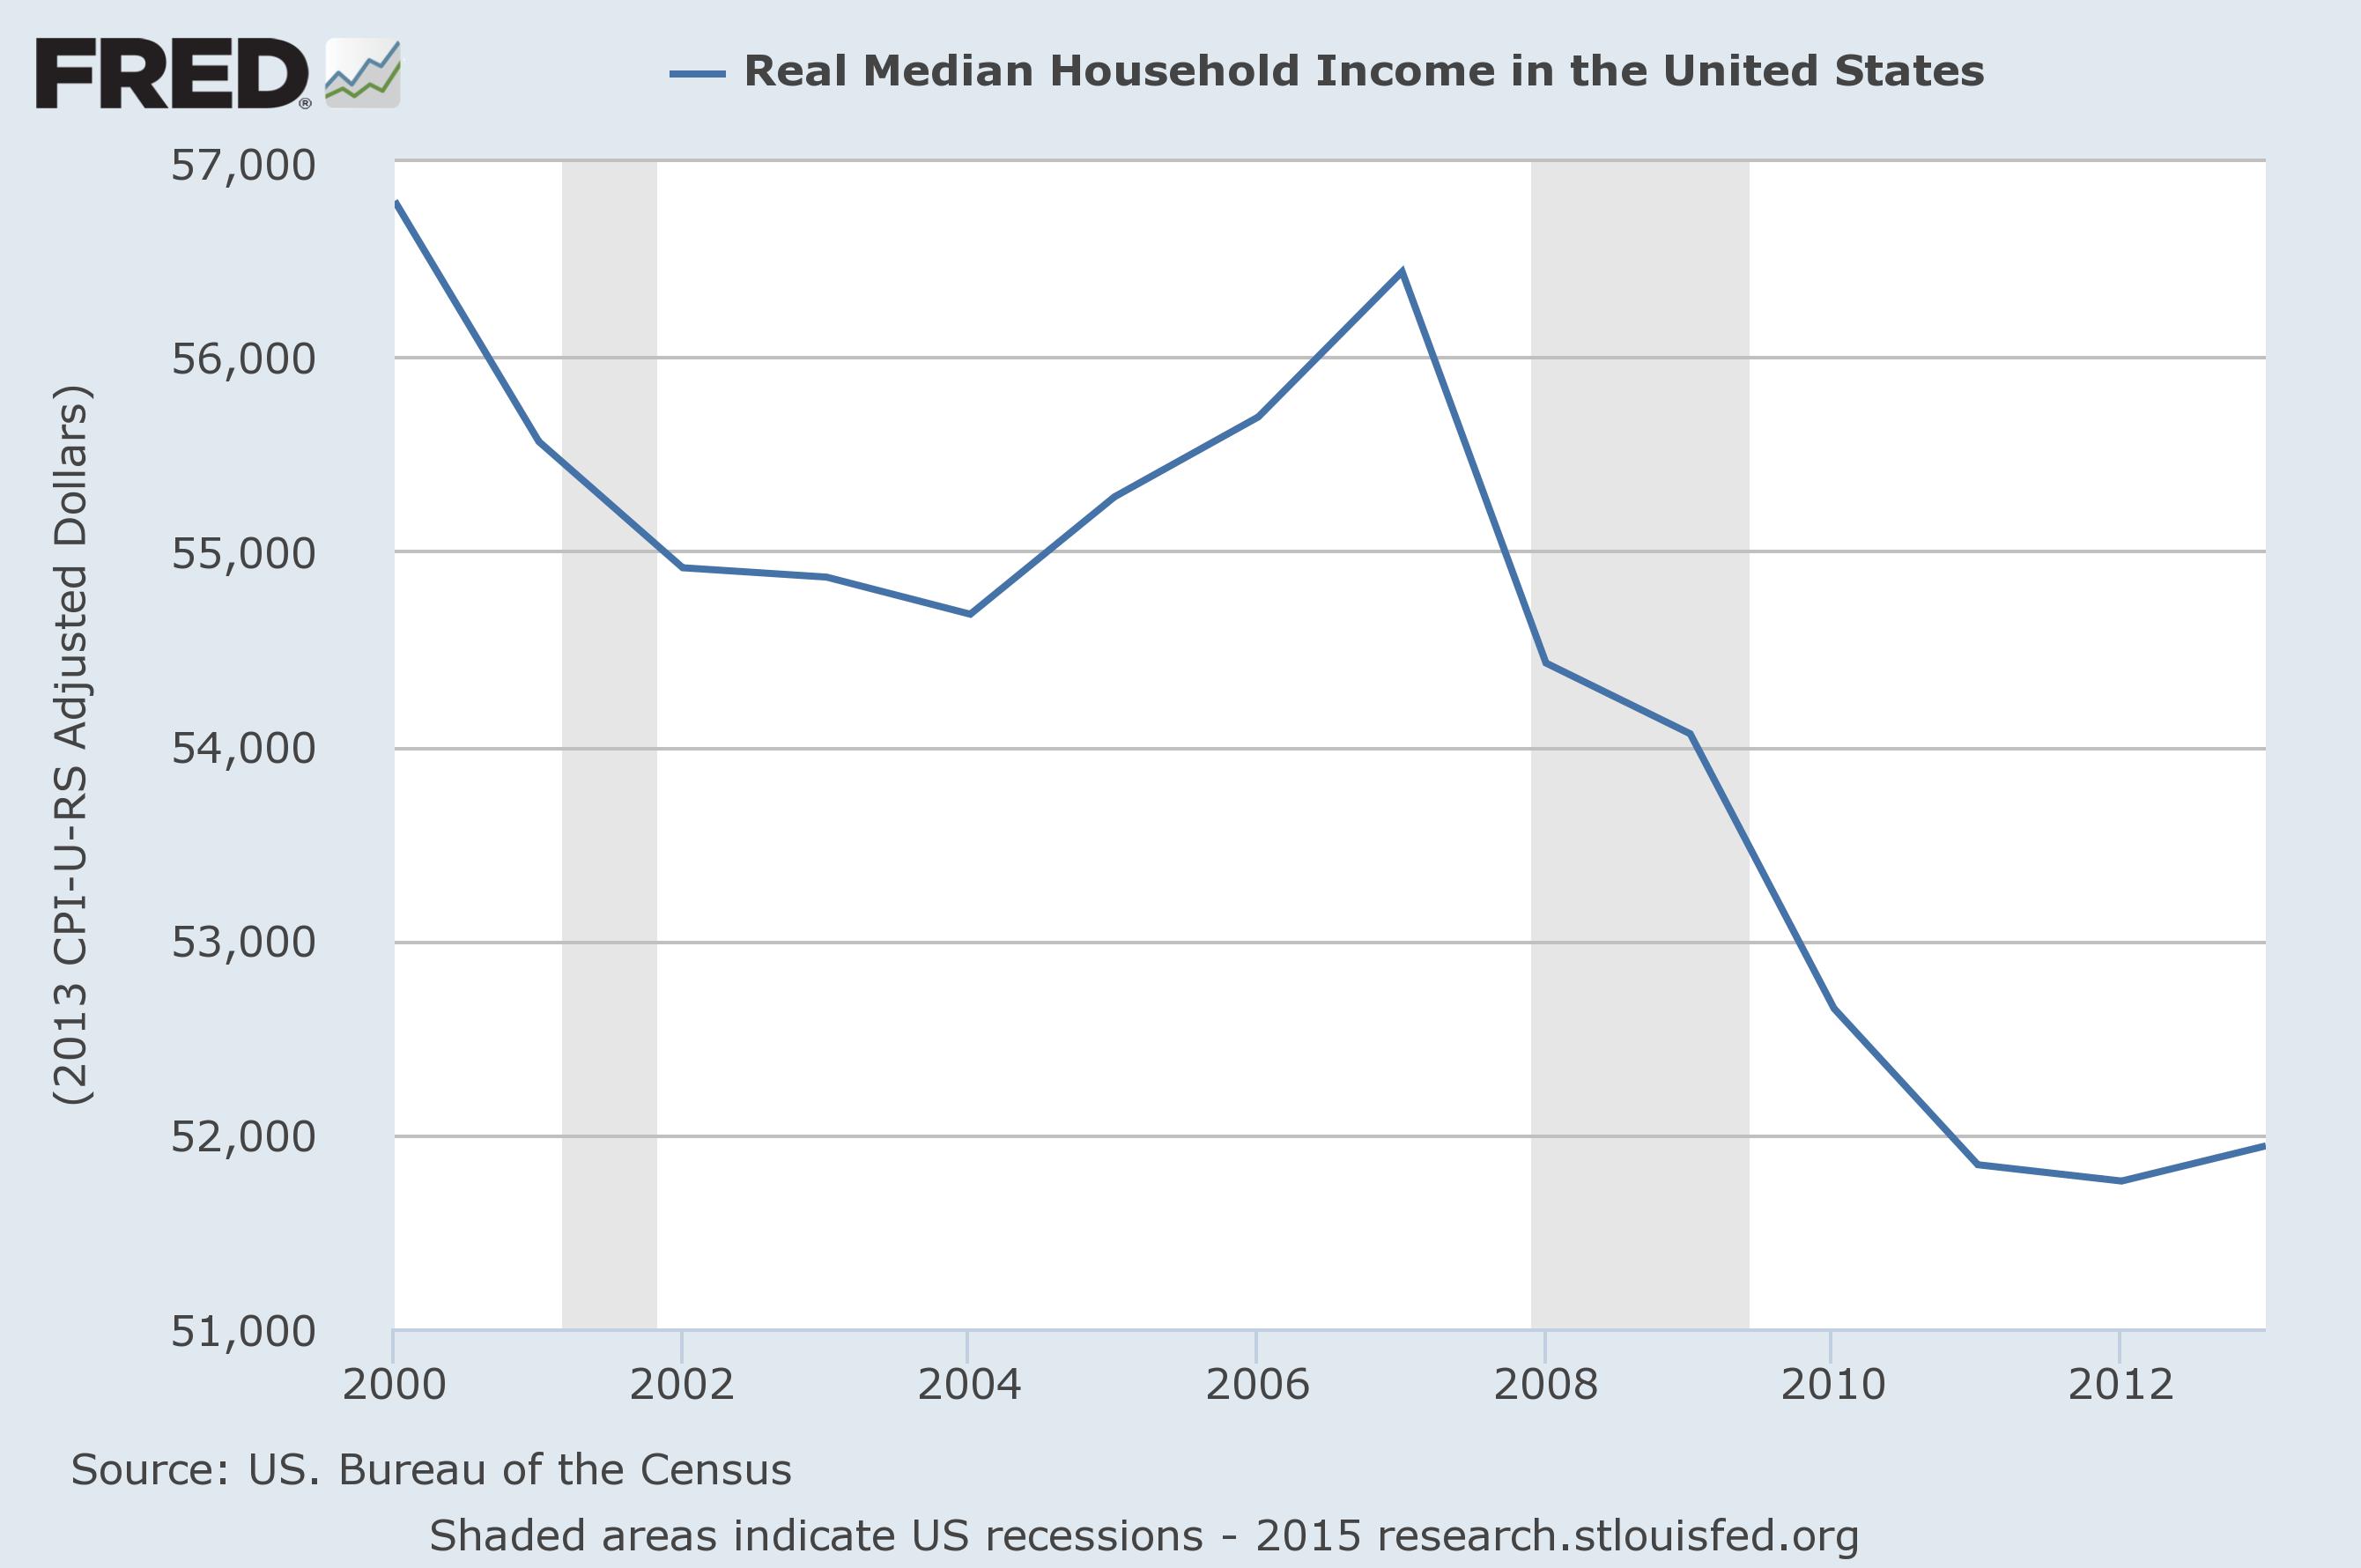
It could be that the USA economic gearing is constraining consumer growth. Maybe 67% of the economy is near the maximum support consumers can provide. However, the more likely cause is the changing income distribution occurring in recent decades that has produced nearly a 10% decline in real median household income since 1999.
The most likely reason the consumer is not adding more to GDP is that they have become poorer.
Other Economic News this Week:
The Econintersect Economic Index for February 2015 continues to show a stable and growing economy - again with a modest decline in growth from last month. All portions of the economy outside our economic model - except residential housing - are showing reasonable expansion. The growth trend line for our model is decelerating, however, if we toss in a few more elements which we analyze (but do not include) in our economic forecast model (such as employment or consumer sentiment) - the trends are improving rather than slowing.
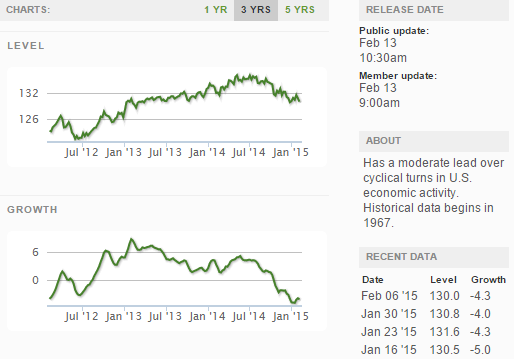
The ECRI WLI growth index value crossed slightly into negative territory which implies the economy will not have grown six months from today.
Current ECRI WLI Growth Index
The market was expecting the weekly initial unemployment claims at 275,000 to 300,000 (consensus 288,000) vs the 304,000 reported. The more important (because of the volatility in the weekly reported claims and seasonality errors in adjusting the data) 4 week moving average moved from 293,000 (reported last week as 292,750) to 289,750. The rolling averages have been equal to or under 300,000 for the 21 of the previous 22 weeks.
Weekly Initial Unemployment Claims - 4 Week Average - Seasonally Adjusted - 2011 (red line), 2012 (green line), 2013 (blue line), 2014 (orange line), 2015 (violet line)
Bankruptcies this Week: Altegrity (aka US Investigations Services), Wet Seal
Click here to view the scorecard table below with active hyperlinks
Weekly Economic Release Scorecard:


