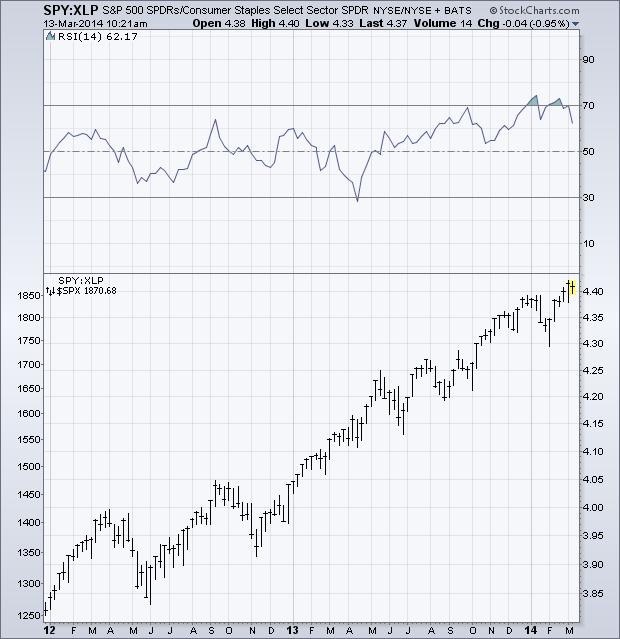
As I go through hundreds of charts each day/week I’m looking at pure price action, comparisons, and indicators on various time frames. Each chart has a unique story and can tell us something different. By watching the relationship between consumer staples (XLP) and the S&P 500 (SPY), we can get an idea of trader’s risk appetite. When we begin to see a shift favoring the defensive sector in momentum, we can start getting cautious that price may be hinting at a potential down turn. Let’s look at some examples.
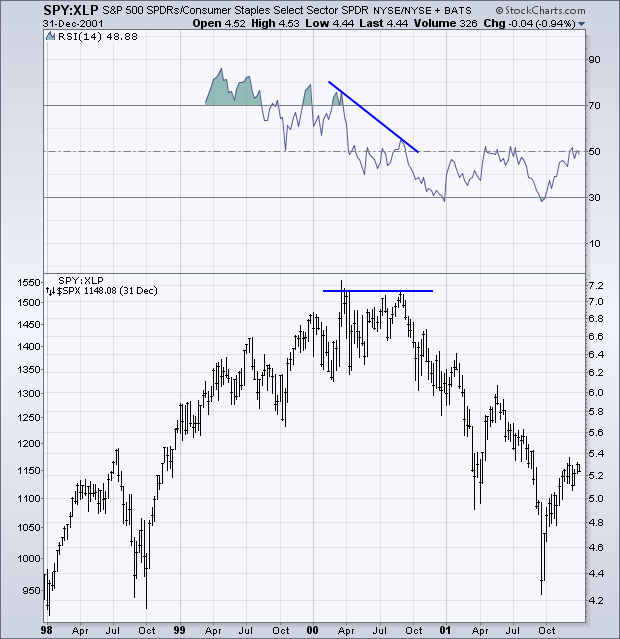
Below is a weekly chart of the price action of the S&P 500 at the 2000 top with the Relative Strength Index (RSI) from the SPY and XLP ratio. As you can see, we saw the momentum indicator break above 70 and then eventually put in a lower high as the equity market made a double top. This told us that traders were showing a stronger preference for the defensive consumer staples sector, which ultimately led to a large bear market decline.
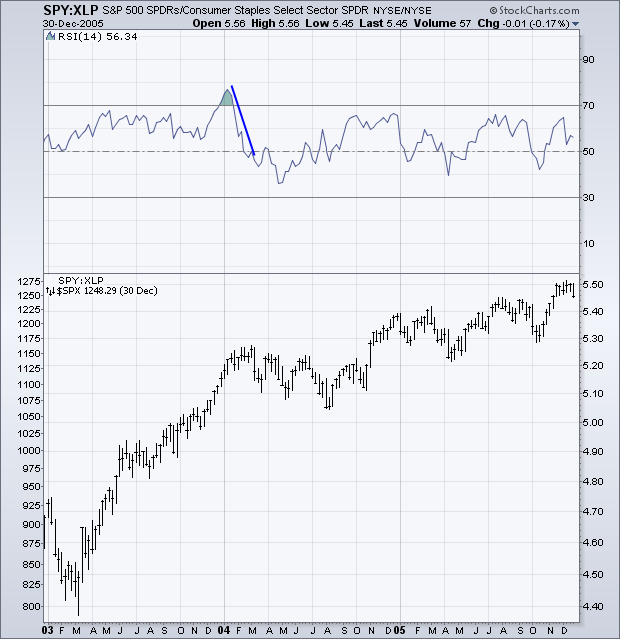
The next occurrence of the Relative Strength Index for the ratio breaking above 70 and creating a negative divergence with the S&P 500 was in 2004. This lower high in momentum happened quickly and lead to a slightly negative consolidation for nearly six months.
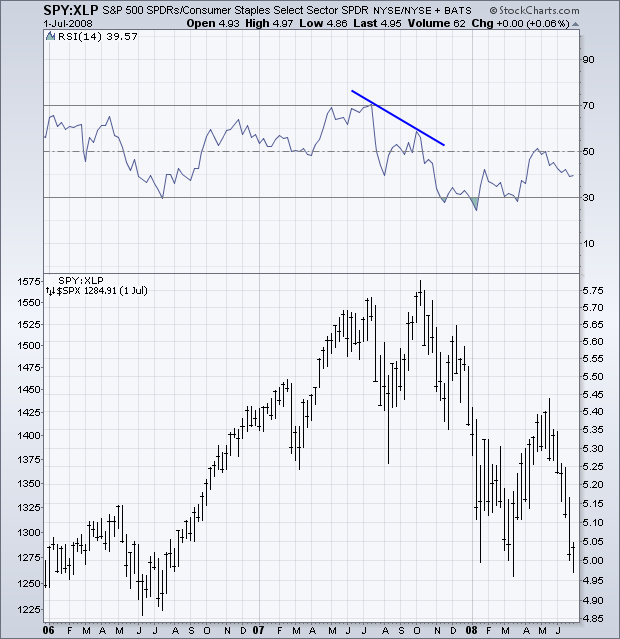
Next we have the top in the S&P 500 in 2007. In July we saw the RSI indicator just barely break above 70 before putting in a lower high leading to the equity peak and multi-year bear market.
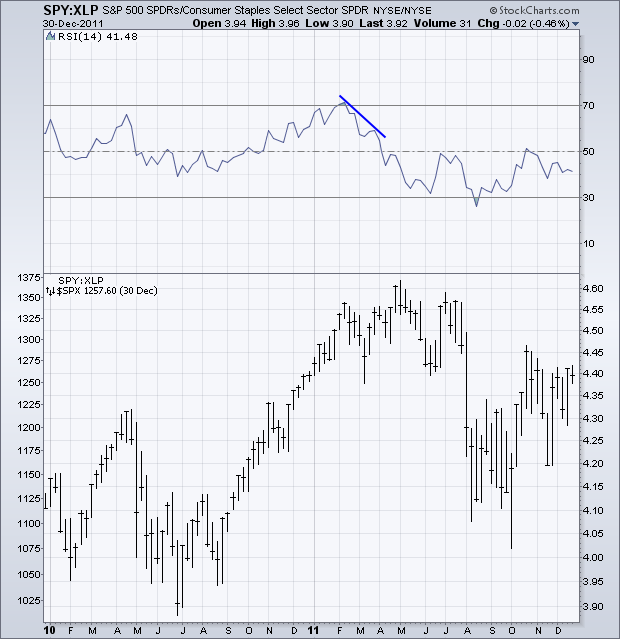
The fourth time we saw a negative divergence in the Relative Strength Index of the ratio between SPY and XLP was in 2011. While many traders point to the conflict over budget in Washington DC as the cause of the mini-bear market in stocks, we were seeing signs of weakness back in April that price was trying to tell us that something may be wrong.
Finally we have the current price action. At the end of last week the momentum indicator registered at 70.11, a few hairs above ‘overbought’ status which means we do not have a divergence just yet. Over the last 15 years we have not see the RSI indicator break above 70 and not eventually create a divergence. However, it’s important to recognize that a data series with just four inputs is by no means robust and history is not required to repeat itself.
I do not write this as an attempt to a call a market top. There are still too many bullish charts to make the assumption we’ve seen the highest prices for 2014 put in already. Although, I think the relationship between consumer staples and the S&P 500 is important and is something I’ll be keeping my eye on over the next few months.

