Oil charts are really interesting if you are into technical movements, they seem to swing wildly on a variety of news, but they also seem to show great pattern and for the most part obey key rules when it comes to movements.

Oil movements were heavy during 2008 and there was massive volatility as people looked to commodities as tangible assets that had value in the face of everything falling apart. I don’t blame them, but oil over a hundred dollars a barrel is uneconomical in the present marketplace and was certainly uneconomical during that period in time.
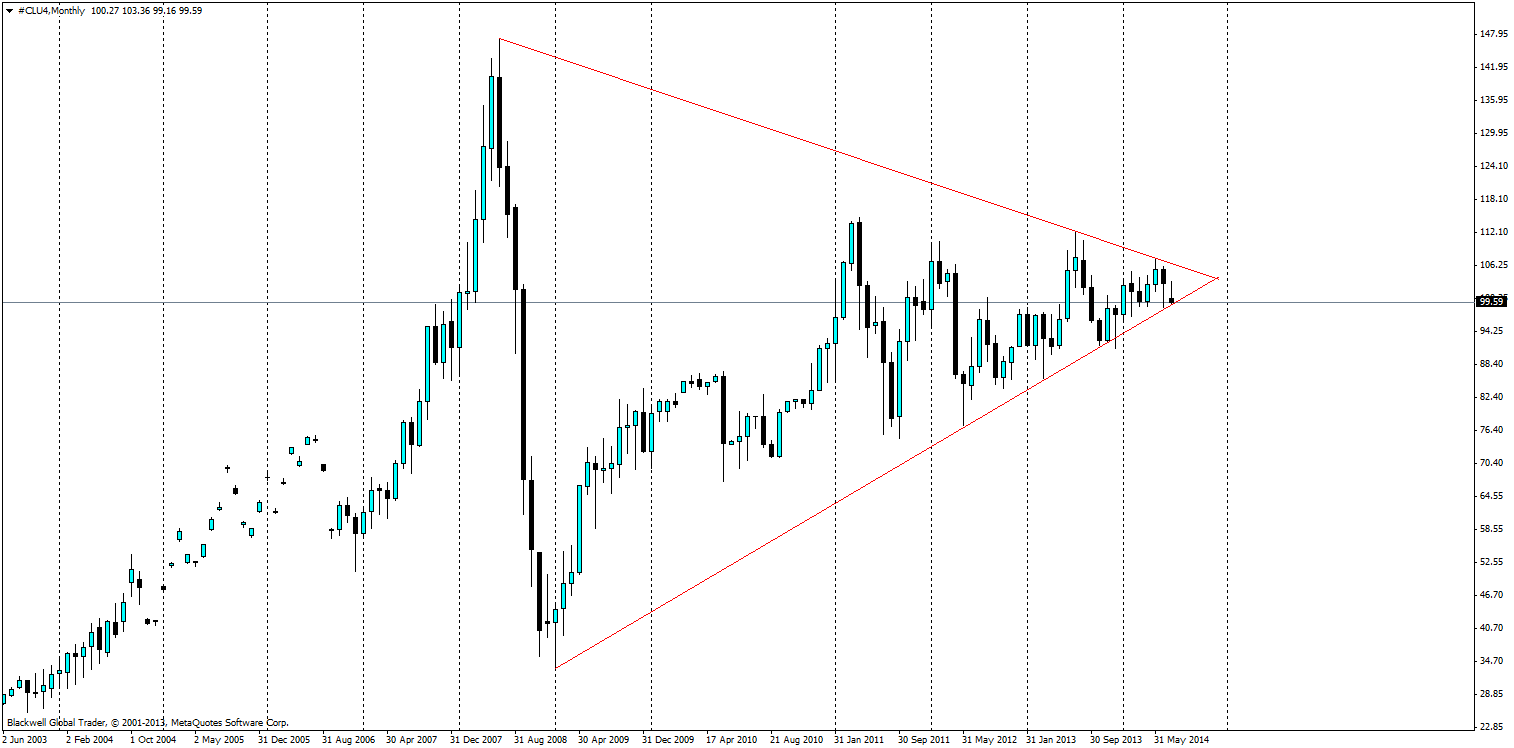
But, to get back to the main point, what I am talking about is the massive pennant pattern which has formed on oil charts over the last 6 years, and I believe something has to give in the coming months as a result of the pattern converging.
Currently there is only one day left on the chart, and a move higher could certainly be on the cards in the coming month as it looks to push off the trend line and back to around the 100 dollar barrel mark.
While so far I have talked up the prospects of 100 dollar barrel of oil, I am against it strongly in the long run. While it may be the lifeblood of the world at this present moment; the advent of fracking has been heavy on the oil market, as oil previously too hard to extract now becomes more accessible.
With the market going forward believing that oil will drop lower and Bloomberg forecasts also pointing to oil dipping longer in the long run , the question is when will the market wake up to this key point and we stop seeing the bulls fighting the future of oil.
