- Recent AAII survey readings came in at 35% bulls and 27% bears. Since the last report in March, AAII bullish readings have fallen ever so slightly, while bearish readings have remained pretty much unchanged. However, turning our attention to the less volatile AAII monthly allocation survey, we can see the investors continue to add exposure towards equities, while reducing their cash levels, a major warning signal of complacency.
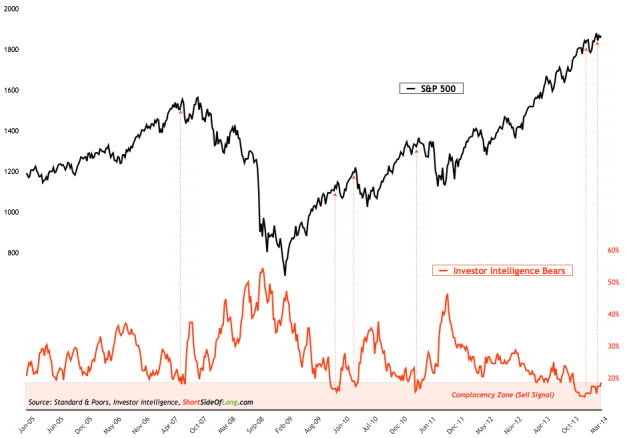
Chart 1: Extremely low level of bearish advisors usually signals a top!
- Recent Investor Intelligence survey levels came in at 51% bulls and 19% bears. Over the last four weeks, bullish readings have pulled back slightly while bearish readings have slowly started to rise. Nevertheless, the chart above shows that for 24 weeks in the row, percentage of bearish advisors has remained below 20%. This type of a sentiment condition is very rare and warns of major complacency amongst investment participants.
- Recent NAAIM survey levels came in at 91% net long exposure, while this week's intensity was recorded at 150%. Over the last month, fund managers have been rising their exposure towards equities on weekly basis, while the intensity of exposure (difference between the most bullish and most bearish exposure) has stayed extremely elevated at 170% net long when averaged over the last 6 weeks.
- Recent ICI fund flows reports showed that “equity funds had estimated inflows of $1.23 billion for the week, compared to estimated outflows of $962 million in the previous week. Domestic equity funds had estimated outflows of $267 million, while estimated inflows to world equity funds were $1.50 billion.” Money continues to flow into the stock market, as seen in this chart showing 15 consecutive monthly inflows. This streak is bound to be broken eventually, as a more meaningful correction starts (more likely sooner rather than later).
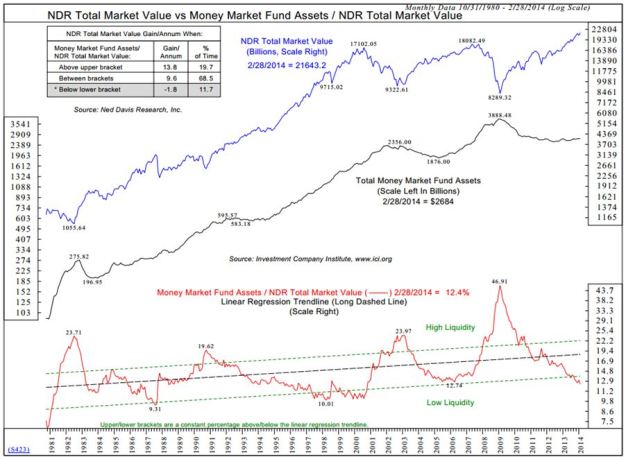
- Moreover, the next sell-off might not be a correction, but rather a bear market. Chart 2 shows that money market funds have diverged quite a lot from the overall broad equity market value, signalling high complacency levels similar to 1981, 1987, 1998, 2000 and 2007. All of those dates were peaks prior to at least a 20% drop in equity prices and some full blown crashes.
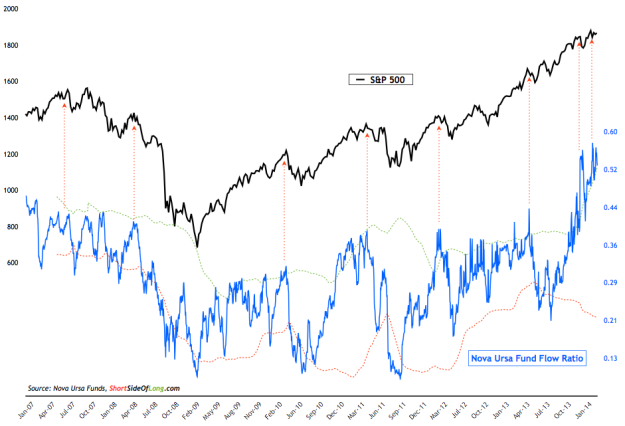
Chart 3: Rydex traders are not only optimistic, they are outright greedy
- Recent Rydex fund flows are rising to higher and higher levels by the day. Rydex traders, usually regarded as dumb money, are pilling into US equities at such a fast rate, you might as well call the long trade a “free lunch”. They are so greedy right now, that they are sure the market will rise to higher and higher levels… in their view most likely “a sure bet”. While previous optimistic levels lead to sharp sell offs as seen in Chart 3, the current level of greed just might lead to something even more worrisome.
- Recent commitment of traders reports (also known as dumb money) showed that speculators have slowly, but surely been closing their net long bets on technology stocks. Hedge funds and other speculators currently hold over just over 74,000 net long contracts, which is a substantial decrease from 113,200 at the start of March. Nevertheless, speculators aren’t anywhere near outright bearish levels yet. Previous months' chart can be seen by clicking here.
- Long term volatility conditions can be seen by looking at the chart here. As the trader in this recent Bloomberg interview states, since 2008 the VIX has settled five times below 14 and now twice below 13. With many traders now purchasing puts on the VIX, it seems that the market consensus is that the low volatility is here to stay. Consensus is rarely right from my own experience, so I would be cautious with this view. Generally speaking, other volatility indicators are also signalling ongoing complacency. These include Junk Bond Credit Spreads, Corporate Bond Credit Default Swaps and 2 Year Dollar & Euro Swap Rates (thanks to Scott Grannis’ blog for charts).
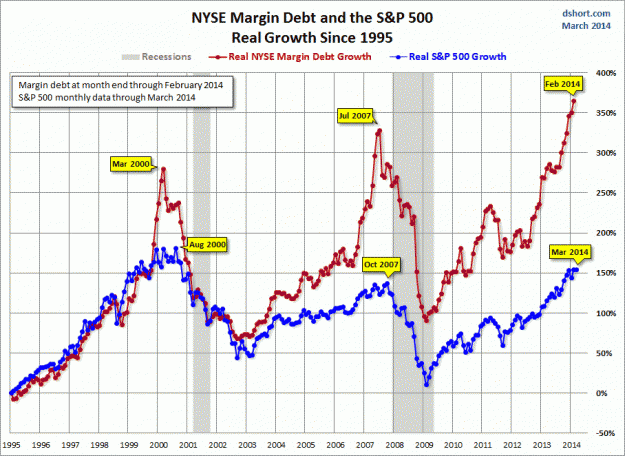
- According to NYSE, Margin Debt (measure of investor leverage) climbed to yet another record high in February 2014. These days, there isn’t a month that passes where we don’t learn that leverage is increasing at an almost exponential pace. Official nominal margin debt readings now stand at $465.72 billion, $14.5 billion higher than last month. Inflation adjusted margin debt in today's dollars is seen in Chart 5, while investor net credit levels, currently at record lows, can be seen by clicking here. Thanks to Doug Short for both charts.
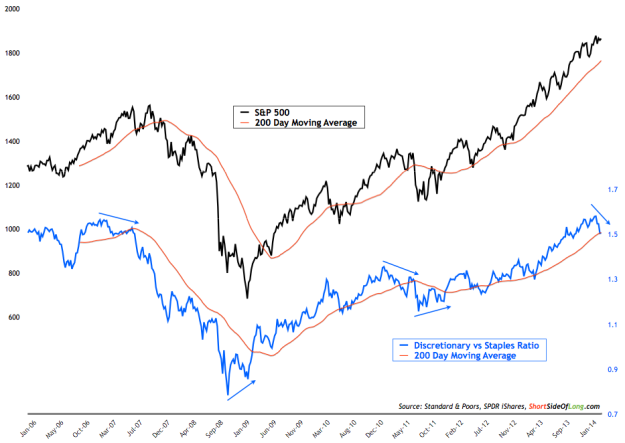
- Side note: I originally warned about the developing weakness in Consumer Discretionary equities all the way back in middle of January. This situation is now developing further, where the Discretionary sectors continue to underperform both the overall market as well as Consumer Staples sector. The chart above shows S&P 500 vs Discretionary / Staples Ratio, which represents the cyclicals vs defensives performance. Usually, cyclical sectors will turn down first before the market peak, as seen in early 2007 and early 2011. The same is true for the bottoming process too, where cyclical sectors sense the recovery before the market itself, as seen during late 2008 and late 2011. Interestingly, we are once again getting a warning from the ratio above, which could potentially mean that the market is now starting a topping process. Watch carefully!
Bonds
- The situation has not changed much in the Bond sentiment surveys compared to the March report. As Treasury prices have mainly moved sideways, so has the sentiment. Both Market Vane Bullish Percentage and Consensus Inc survey remain at or close to neutral level. Neither of these surveys is giving us any contrarian signals worthy of a trade nor an investment right now. However, the fund flows towards corporate debt and especially the junk bond market (easily seen with narrowing spreads), is very frothy right now.
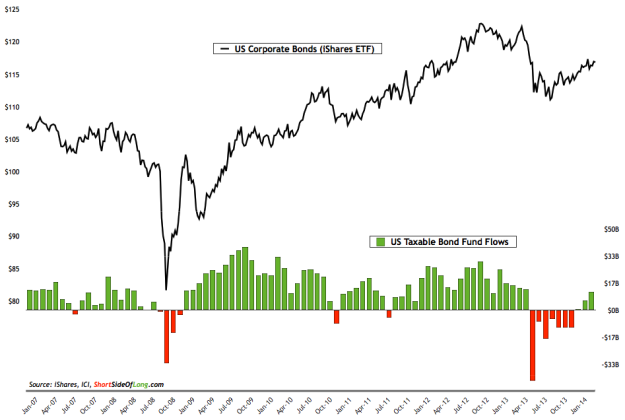
- Recent ICI fund flows reports showed that “bond funds had estimated inflows of $1.28 billion, compared to estimated inflows of $2.48 billion during the previous week. Taxable bond funds saw estimated inflows of $1.23 billion, while municipal bond funds had estimated inflows of $49 million.” Retail investor panic is usually a signal to buy an asset, and this was once again proven by the corporate bond price sell-off in 2013 (seen in the chart above). Large fund outflows by the public usually occur near market troughs and this time was no different. The price has managed to bottom and rally somewhat, gifting those contrarians who went against the herd a decent total return (including the yield) for a few quarters now. Interestingly, as the rally continues, the fund flows are back again.
-
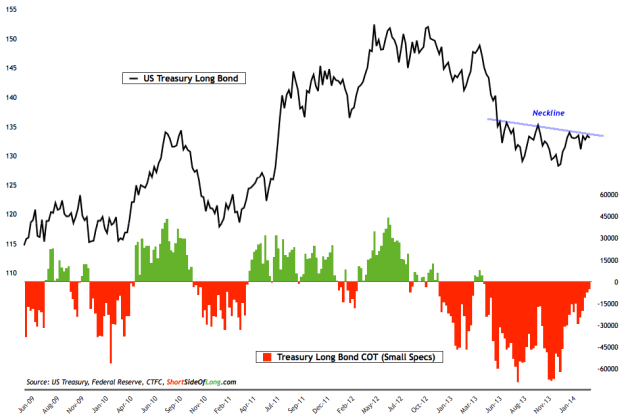
Recent commitment of traders reports (also known as dumb money) show that small speculators have just about closed all of their net short bets against Treasury Bonds. Recent COT reports show that small speculators now hold only -5,000 net short contracts. Personally, I believe that specs could actually turn net long on the Treasury Bond market if and when the equity market experiences a more significant correction. A warning signal for the equity market could be the inverse correlation with bonds and a possible breakout from the current basing pattern. Watch that neckline closing on the Long Bond.
Commodities
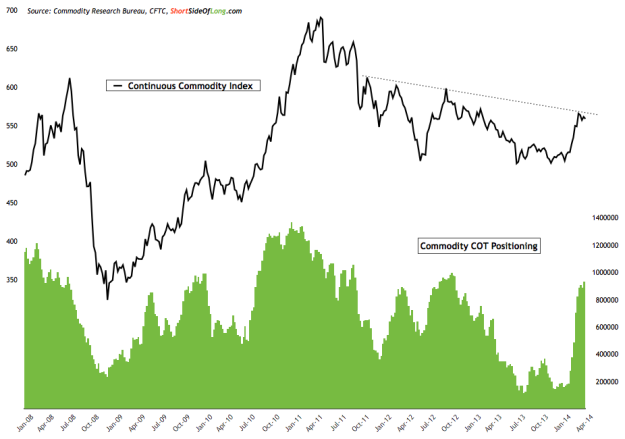
Chart 8: Commodity index reaches resistance as specs build positions
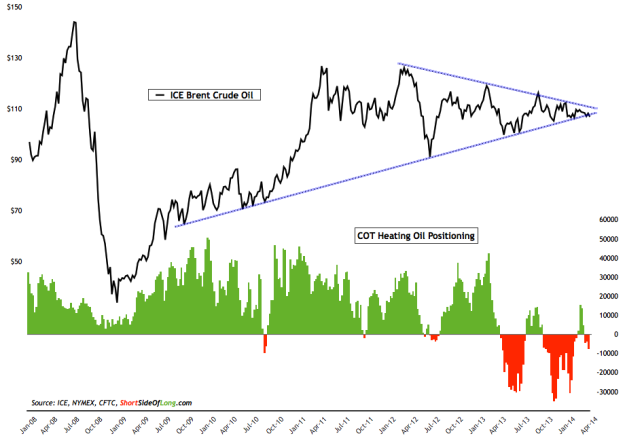
- The recent commitment of traders reports (also known as dumb money) showed that hedge funds and other speculators continue to remain very bullish toward the overall commodity complex, with exposure reaching over 930,000 net long contracts (custom COT). This is now the highest net long exposure since September 2012, just before the price peaked. The majority of the net long contract building has come from Agricultural and Precious Metal sectors, which have rallied decently over the last quarter. The chart above shows that the equal weighted commodity index has now reached a technical resistance area and it's time for consolidation.
Chart 9: Brent Crude Oil is acting very weak despite the commodity rally
-
As already discussed in a few posts as well as last months sentiment report, several industrial commodities that are economically sensitive are acting rather weak. One of these is Brent Crude, the global barometer for energy prices. As we can see in the chart above, prices peaked out during the Lybian Crisis into May 2011. For the last three years, prices have gone essentially nowhere. Technically, Brent Crude is now at crossroads, with a major price decision looming in coming days or weeks. Pay a close attention to this one, as it could be an important signal for the overall global economy.
Currencies
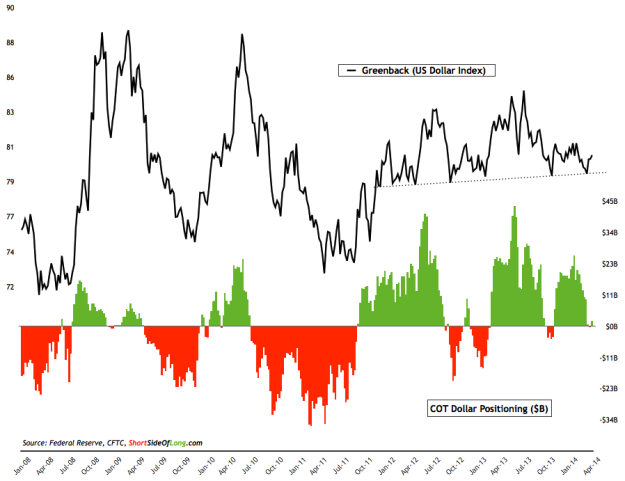
Chart 10: Dollar positioning is neutral as price holds important support
-
Recent commitment of traders reports (also known as dumb money) have shown a gradual decrease in bullish positioning towards the US dollar. During the last report in early March, cumulative G10 positioning by hedge funds and other speculators stood at $10.3 billion net longs. The sell off that occurred into the Fed press conference shook those net long speculators out completely, with current positioning pretty much at neutral levels (neither long nor short). Comments by Fed Chair(wo)man Yellen have changed the dynamics of the currency markets a bit, with the U.S. dollar bouncing off its support. At the same time the euro, pound, franc and yen have been rather weak of late.
Chart 11: Canadian Dollar is one of the more hated currencies right now
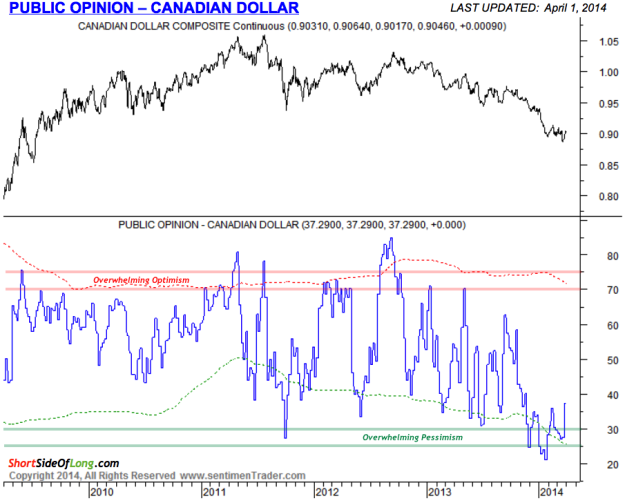
Source: SentimenTrader (edited by Short Side of Long)
- Sentiment survey readings on various currencies has been skewed towards European continent strength and Emerging Market weakness, which has sort of created a US Dollar neutrality, so to speak. Having said that, commodity currencies like the Aussie and in particular the loonie continue to under-perform. As we can see in the chart above, thanks to SentimenTrader, survey readings have now fallen to negative extremes last seen during the GFC and late 2008 panic sell off. Let us not forget that the Canadian dollar peaked all the way back in the middle of 2011 and has been in a bear market for three years now. The currency is down 7.3% over the last 12 months and almost 13% over the last three years (the worst 3 year performance since 1998).
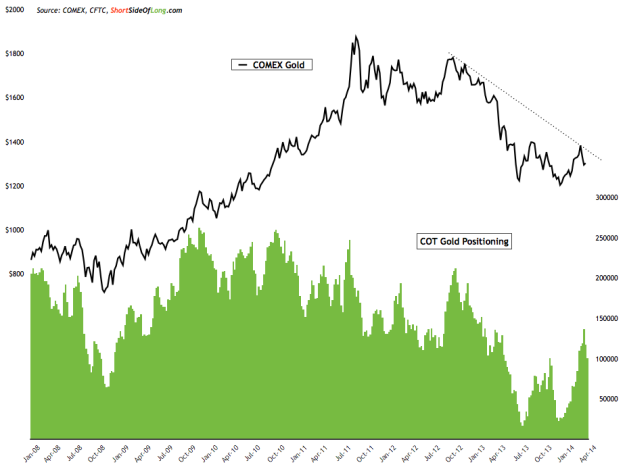
Chart 12: Hedge funds are once again cutting their net long bets on PMs
-
Recent commitment of traders reports (also known as dumb money) showed hedge funds and other speculators burnt by jumping onto the precious metals too late. Last month's report warned that Gold, as well as Gold Miners, were becoming very overbought in the short term and a correction was looming. Interestingly, just before the correction started, specs increased net longs in Gold and Silver substantially. Now, with a price drop, we see those positions closed again. Current Gold hedge fund positioning stands just over 100,000 net longs; while current Silver hedge fund positioning stands at just over 14,500 net longs. Respectively, that is 31.4% net longs as a percentage of open interest in Gold and 18.9% in Silver. Not yet close to single digits associated with intermediate bottoms and buying opportunities.

