
SPX closed at the upper weekly bollinger band on Friday for the fourth week running. This can last a while, but it's worth noting that at this stage we are unlikely to see big moves above the upper band and that band is only rising about ten points per week. Short term upside is therefore limited and any further moves up under the band before we see a significant retracement are likely to be slow.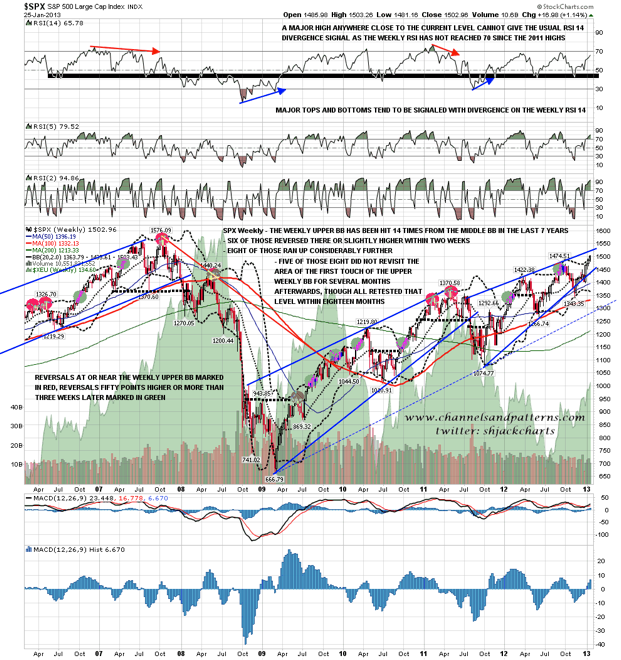
I've been looking again at the SPX 60min chart and there could be a broadening ascending wedge forming from the November low. It would need a decline into wedge support and reversal back up to confirm though really. In the short term it's worth noting that there is some negative divergence on the 60min RSI and a possible short term M top forming with a target in the 1481 area on a break below 1492.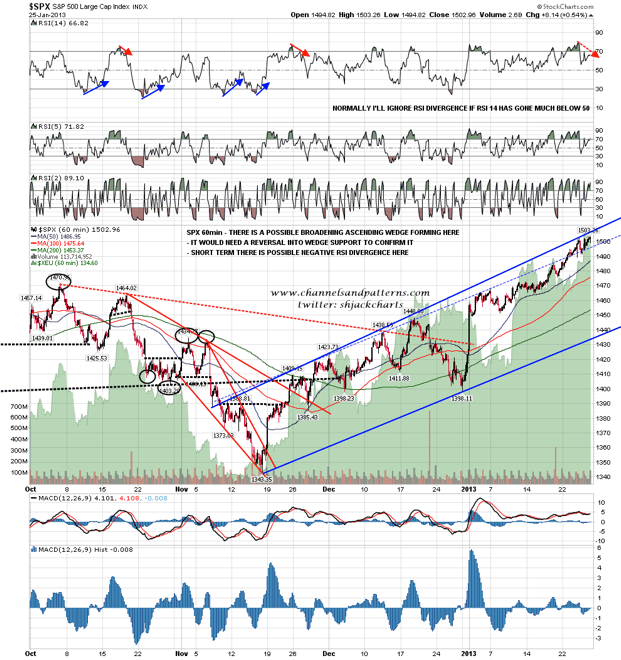
AAPL tested channel support at 435 on Friday. This is my primary support trendline for AAPL and a break below would be a big technical break. It is a very steep trendline however, with the first touch in 2003 at 6.25, and a break below would signal most likely only that AAPL has moved into a new phase that won't include huge moves upward. On that break below however, the next obvious target is strong support around the 360 area.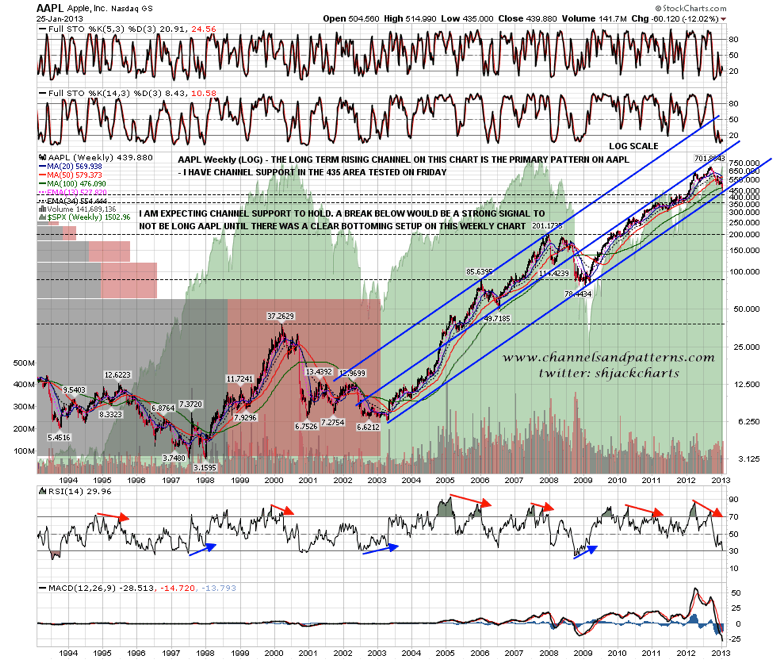
I have posted two scenarios on EURUSD over the last couple of weeks and we have now reached the point of decision where EURUSD should go one way or the other. On the bull side I was looking at the sloping IHS with a target in the 1.42 area last week and that is a nice technical fit with a move to test declining resistance from the 2008 high. On the (short term only) bear side we could see an alternate IHS form with a horizontal neckline in the 134.8 area, and that was tested at the high last week. If that forms we would now see a right shoulder retracement lasting months with an ideal right shoulder low in the 126-7 area.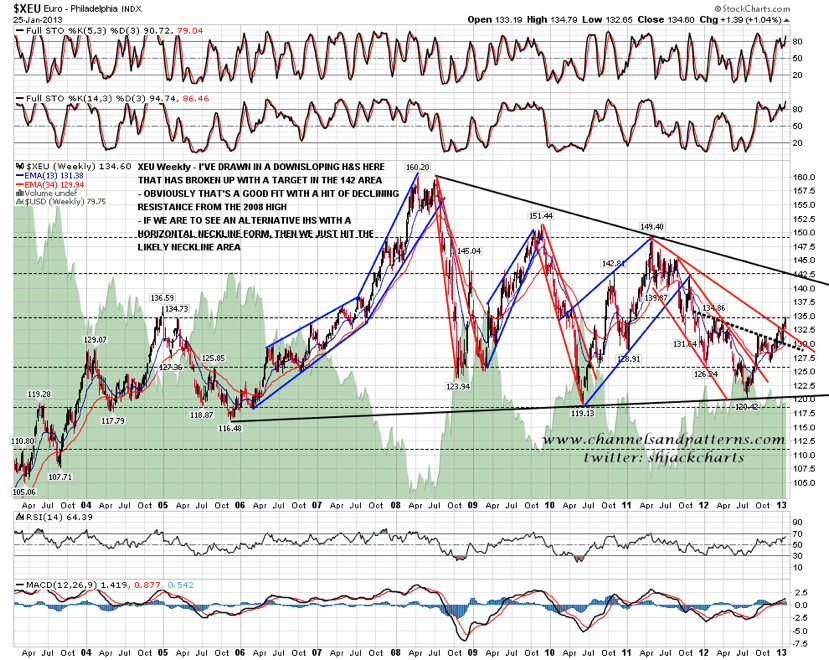
Is it possible that we could see a big reversal like that on EURUSD? I think so yes, though technically I prefer the other scenario. EURUSD has been strong in recent months, but since the end of 2012 it has been plowing a lonely furrow of strength against USD. That has a big impact on USD, as EURUSD is 57.6% of the basket of currencies that make up the USD valuation, but elsewhere USD has been looking impressively strong.
I watch five main currency pairs for USD on a regular basis and they are EURUSD (57.6%), JPYUSD (13.6%), GBPUSD (11.9%), CADUSD (9.1%), and AUDUSD (not in USD basket). Since the end of 2012 all of the other four have fallen significantly against USD to the extent that even though EURUSD has gained significantly over this period, USD is flat. I don't know what this is telling us overall, but I do know that the Yen (JPYUSD) is in very serious trouble, and may fall a long way below current levels, and the next largest component GBPUSD has also been showing a lot of weakness in recent weeks, to the extent that last week GBPUSD broke below the trigger level on a double-top indicating back to the 1.536 level, effectively a test of the summer 2012 lows. If this pattern is going to fail then the likely place is right here, just below broken pattern support, but if it continues down below 1.57, the chances are that those lows will be tested in the next few weeks. If we see a big reversal on EURUSD here as well we could therefore see a very impressive rally on USD over the next few weeks. Here's that setup on the GBPUSD daily chart.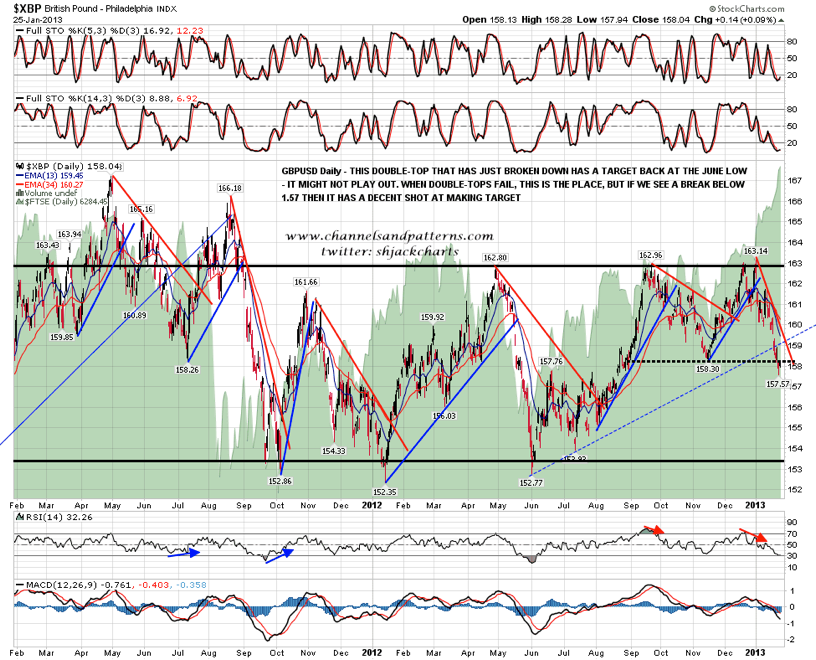
For today on ES I have some weak trendline support and the 50-hour MA in the 1493.5 ES area. Secondary support is at 1490.75 at Friday's low. If we see a break below Friday's low the next obvious support is in the 1486.5 area. I have some trendline resistance in the 1501.5 area.
- English (UK)
- English (India)
- English (Canada)
- English (Australia)
- English (South Africa)
- English (Philippines)
- English (Nigeria)
- Deutsch
- Español (España)
- Español (México)
- Français
- Italiano
- Nederlands
- Português (Portugal)
- Polski
- Português (Brasil)
- Русский
- Türkçe
- العربية
- Ελληνικά
- Svenska
- Suomi
- עברית
- 日本語
- 한국어
- 简体中文
- 繁體中文
- Bahasa Indonesia
- Bahasa Melayu
- ไทย
- Tiếng Việt
- हिंदी
Apple Tests Primary Support
Latest comments
Loading next article…
Install Our App
Risk Disclosure: Trading in financial instruments and/or cryptocurrencies involves high risks including the risk of losing some, or all, of your investment amount, and may not be suitable for all investors. Prices of cryptocurrencies are extremely volatile and may be affected by external factors such as financial, regulatory or political events. Trading on margin increases the financial risks.
Before deciding to trade in financial instrument or cryptocurrencies you should be fully informed of the risks and costs associated with trading the financial markets, carefully consider your investment objectives, level of experience, and risk appetite, and seek professional advice where needed.
Fusion Media would like to remind you that the data contained in this website is not necessarily real-time nor accurate. The data and prices on the website are not necessarily provided by any market or exchange, but may be provided by market makers, and so prices may not be accurate and may differ from the actual price at any given market, meaning prices are indicative and not appropriate for trading purposes. Fusion Media and any provider of the data contained in this website will not accept liability for any loss or damage as a result of your trading, or your reliance on the information contained within this website.
It is prohibited to use, store, reproduce, display, modify, transmit or distribute the data contained in this website without the explicit prior written permission of Fusion Media and/or the data provider. All intellectual property rights are reserved by the providers and/or the exchange providing the data contained in this website.
Fusion Media may be compensated by the advertisers that appear on the website, based on your interaction with the advertisements or advertisers.
© 2007-2025 - Fusion Media Limited. All Rights Reserved.