Investing.com’s stocks of the week
The market didn’t even give Apple (NASDAQ:AAPL) stock time to fully recovery from its 2018 collapse. The shares are down by over 12.6% in just four trading days after trade war and antitrust fears spooked investors.
One of the best investment strategies is all about buying high quality companies when their stock price is down. Apple is undoubtedly a great company. Is the current weakness a buying opportunity or the beginning of a much bigger selloff? Let’s see if Elliott Wave analysis can help us answer that question.

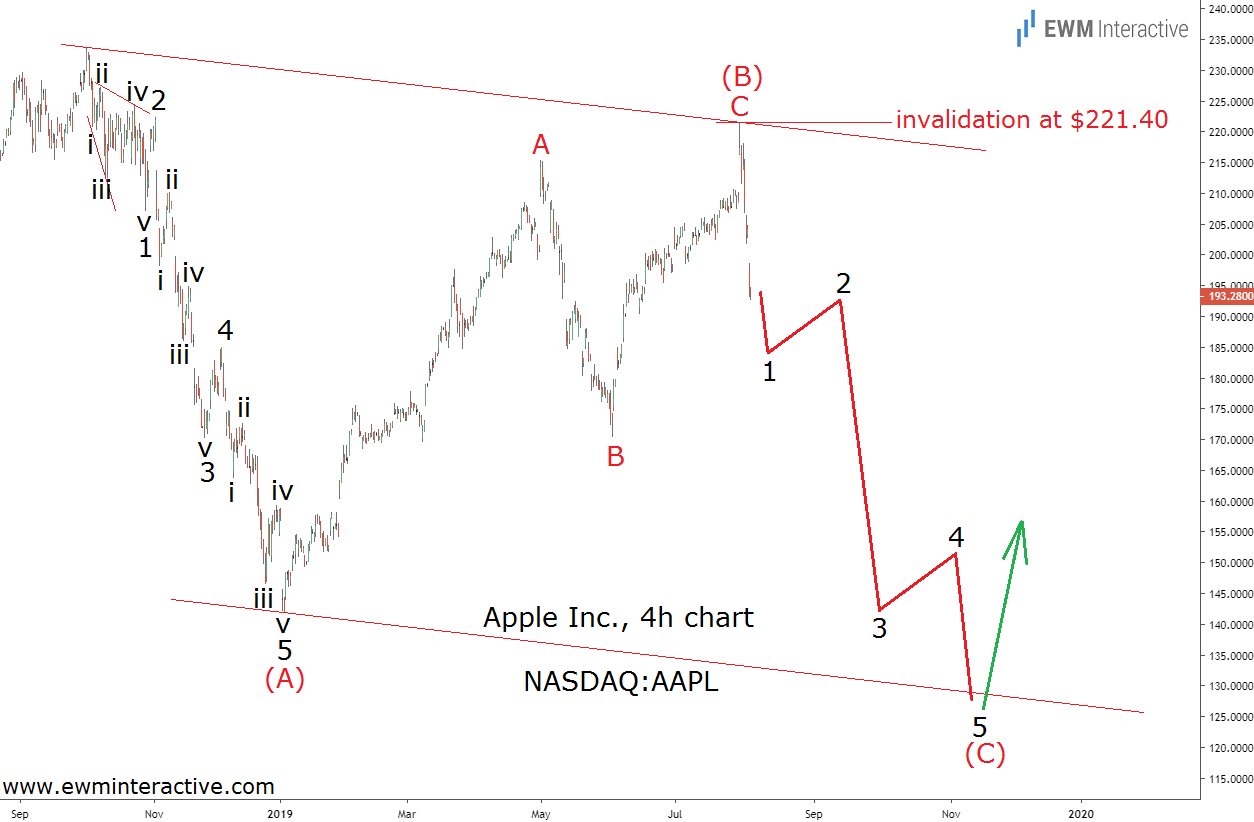
The 4-hour chart of AAPL reveals the stock’s behavior since the top at $233.47 in October 2018. The crash to $142 by January 3rd, 2019, can be seen as a five-wave impulse. The pattern is labeled 1-2-3-4-5, where wave 1 is an expanding leading diagonal. The five sub-waves of waves 3 and 5 are also visible.
This means the recovery to $221.37 is simply the corresponding three-wave retracement, which follows every impulse. Take together, the impulse pattern and the following A-B-C correction form a complete 5-3 wave cycle. If this count is correct, Apple stock has waves (A) and (B) already in place. According to the theory, another impulse in wave (C) to the south can now be expected.
The lower line of the channel drawn through the last two highs and the bottom of wave (A) gives us a rough estimate of wave (C)’s target. It looks like the decline from $221.37 is just the start of a bigger selloff towards $130-$120. The bears remain on the wheel as long as Apple stock trades below the top of wave (B).
