Crude and precious metals continue to suffer, but maybe it’s time for traders to add more sugar to their diets?
Crude Oil
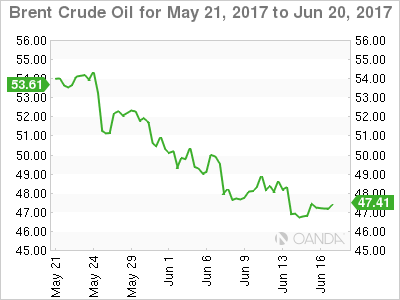
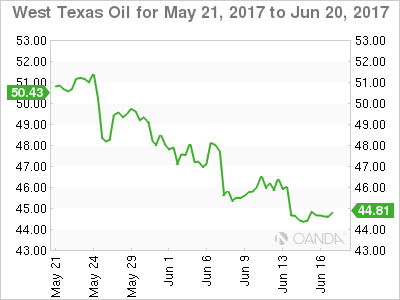
Oil lifted itself off the floor at the end of the week as traders squared up into the weekend, with both brent and WTI gaining about 1.0%. Crude, however, remains firmly in the naughty corner with both crude contracts merely managing to tread water near their week’s lows.
News that Libyan production has surged to 830,000 bpd won’t help the mood in OPEC headquarters, and the market seems to be discounting the shooting down of a Syrian warplane by the U.S. this weekend.
In a very light data week globally, traders will focus more on oil’s market fundamentals which aren’t looking good as the U.S. again added more rigs from Friday night’s Baker Hugh’s Rig Count. With a steady contango in the futures market, shale producer will also no doubt, be looking to hedge production in the forward contracts on any sniff of a rally.
Brent
Brent spot closed at 47.20 on Friday with support at 46.50 and then 46.30. Resistance comes in at 47.50 and then 48.50.
WTI
WTI spot trade sat 44.60, unchanged from its Friday close. Support lies at 44.20 and then the all-important 43.50 level. Resistance is at 45.00 followed by 46.00.
Precious Metals
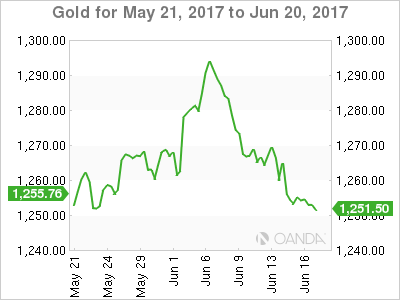
Precious metals are also desperately looking for friends to start the week as well. A stronger U.S.Dollar and lack of geopolitical risk has seen the washout continue as stale longs put on at unattractive levels above the market continue to be slowly grou7nd out. Over on the physical side, buyers from India have yet to make an appearance on this dip suggesting they think they will get better levels.
Gold
Gold enters the European session at 1250.70, near its lows for the day and eyeing initial support at 1250.00. Below here lies the 100-day moving average at 1247.15 followed by the 1246.00 double bottom.
Resistance is at 1256.00 first up followed by 1257.50 with a break suggesting any rally could extend to 1267.00.
Silver
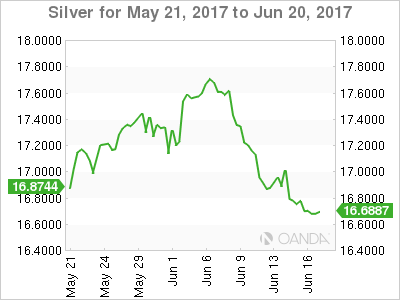
Silver trades in early Europe at 16.6380 with support close by at 16.6150 followed by the 16.4200 regions.
Resistance appears at 16.8500 with a break higher potentially opening a technical retest of the 17.0000 level.
Platinum
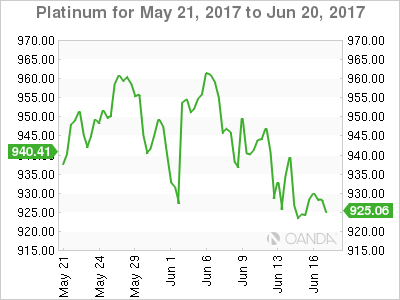
Platinum has been ranging in a 920.00/960.00 consolidation pattern since mid-May and is approaching the bottom of this at 926.20 in early Europe.
Platinum has resistance at 930.00 in the short term with then 942.00. At 962.50 and 64.00 we have the 100 and 200-day moving averages which form a formidable technical resistance in the longer term.
A break below 920.00 suggests a retest of the 900.00 level from a technical perspective. Platinum’s long run outlook could darken if the 15-month lows at the 889.00 area break.
Palladium
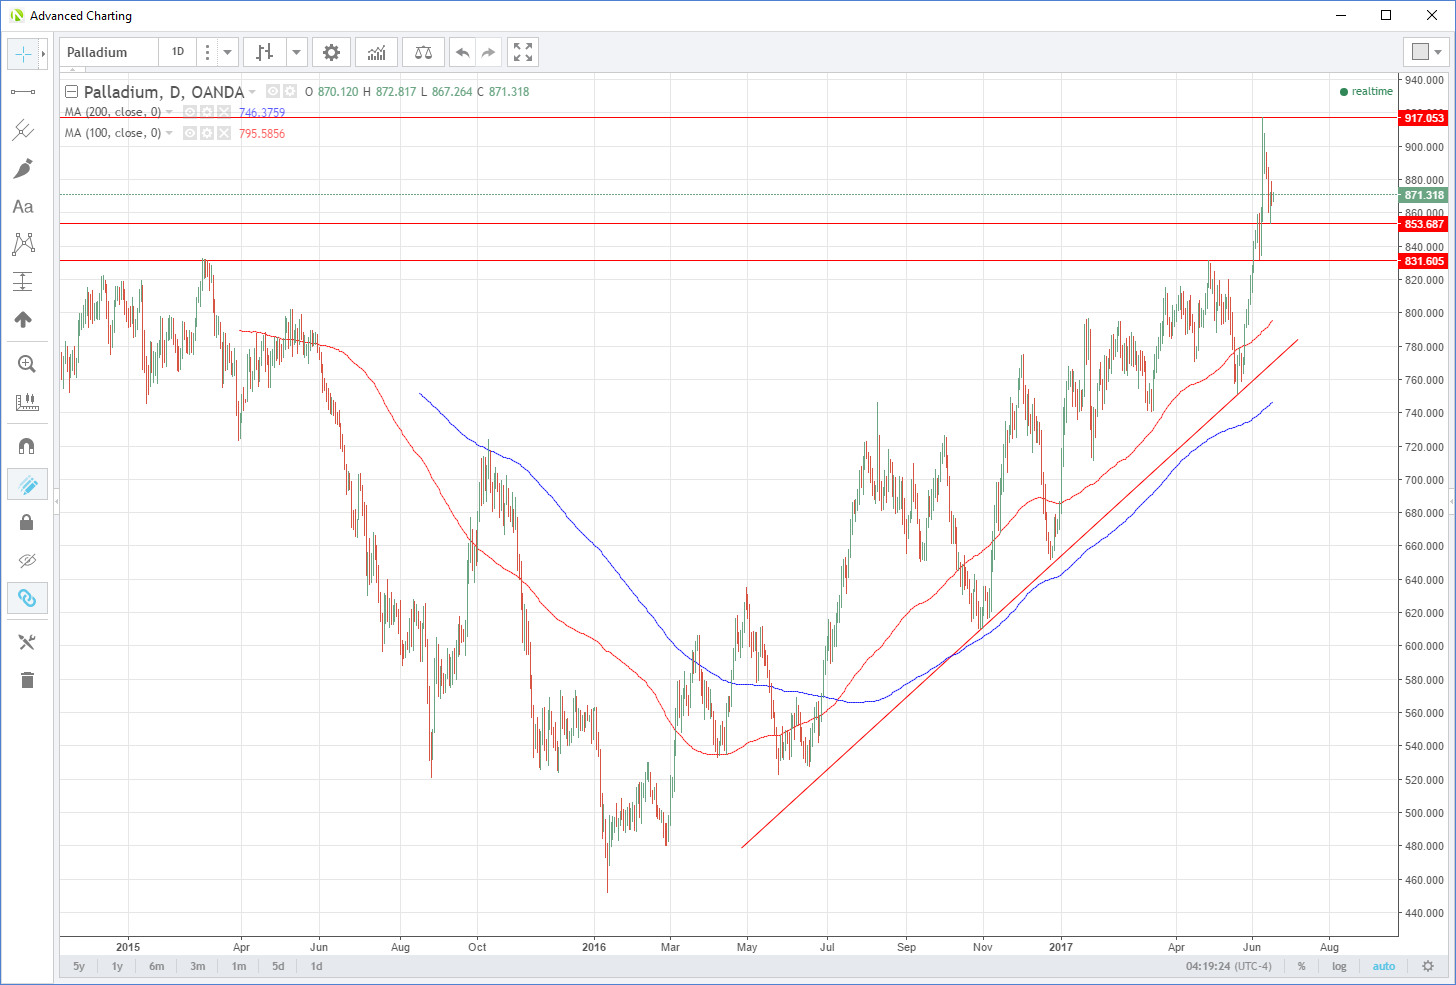
Perhaps the brightest spot in the precious metals complex is palladium, reflecting its dual precious/industrial use in the world. Having given back nearly all its 10.50% rally in the early part of last week, Palladium remains in a 15-month technical uptrend. In fact, even with Palladium trading at 870.75 presently, it would have to break its long-term trendline support at 770.50 to jeopardise the rally from a chart perspective.
In the nearer term, Palladium has support at 854.00 and then 831.00 with resistance still last week’s panic buying high of 918.00.
Softs
Sugar
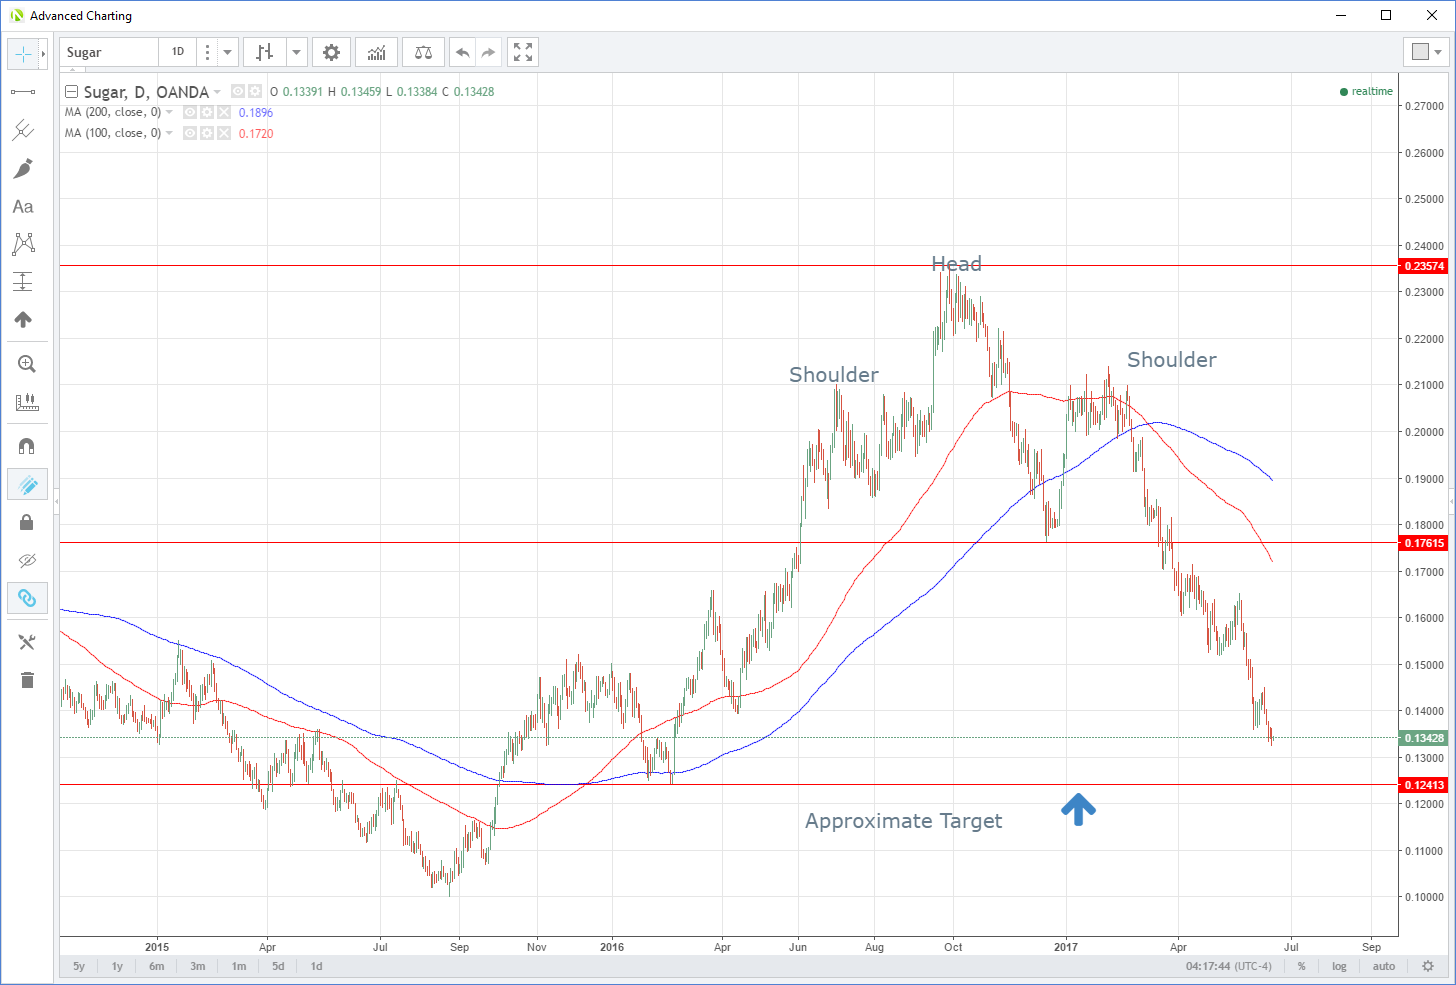
I don’t often write about sugar, but the daily chart has my attention. Optimal growing conditions in major sugar producing countries have seen sugar become more unloved by markets faster than it would be at a Weight Watchers convention.
The head and shoulders pattern on the daily chart suggested a break of the neckline, at 0.17615, could target 0.11650.
With the April 2016 low at 0.12450 not too far from this level, the technical picture could suggest it may be time to “borrow some sugar”. At these levels, there is possibly a lot of optimal global harvest conditions built into the price.
