
Aon plc’s (NYSE:AON) second-quarter 2017 adjusted operating earnings of $1.45 came in line with the Zacks Consensus Estimate. Earnings also increased 13.3% from the year-ago quarter on higher revenues.
Adjusted margin, adjusted for certain items, increased 110 basis points to 22.4%.
Operational Update
Aon’s total revenue grew 4% to $2.4 billion in the second quarter and also surpassed the Zacks Consensus Estimate by 0.4%. The year-over-year increase in revenues was supported by 3% organic revenue growth and a 3% increase related to acquisitions, net of divestitures, partially offset by a 2% unfavorable impact from foreign currency translation.
Operating expenses increased 31% year over year to $2.5 billion in the second quarter. The rise was primarily due to $380 million non-cash impairment charge to the associated indefinite lived trade names related to the sale of the Benefits Administration and HR Business Process Outsourcing (BPO) platform. In addition, higher restructuring costs, acquisition related expenses, regulatory costs and depreciation & amortization also led to this deterioration. However, this was partially offset by the favorable impact of currency translations, expense related to certain non-cash pension settlements in the prior-year period and savings from restructuring activities and operational initiatives.
Organic Revenue Drivers
Commercial Risk Solutions: Organic revenues increased 2% year over year, driven by strong growth across the Pacific region, in both Australia and New Zealand, and solid growth in the U.S. and Canada. This was partially offset by a modest decline in Latin America and Asia.
Reinsurance Solutions: Organic revenues increased 6% from the prior-year quarter on the back of strong growth in capital markets, as well as growth in facultative placements and net new business generation in treaty. The improvement was partially offset by a modest unfavorable market impact globally.
Retirement Solutions: Organic revenues grew 1% from the prior-year period, driven by continued growth in investment consulting, primarily for delegated investment management. This was partially offset by a decline in talent practice.
Health Solutions: Organic revenues rose 5% year over year owing to solid growth globally in health & benefits brokerage, highlighted by strong growth in the U.S., Asia, and EMEA.
Data & Analytic Services: Organic revenues climbed 4% from the prior-year period driven by strong growth across Affinity, with strength particularly in the U.S.
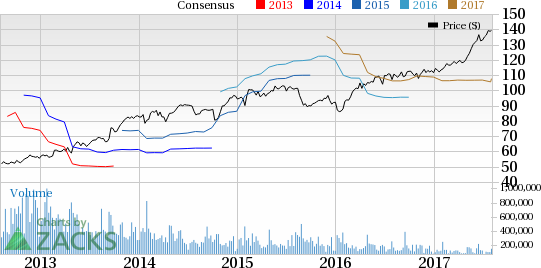
Aon PLC Price, Consensus and EPS Surprise
Financial Position
Cash flow from operations for the first six months of 2017 decreased 22%, to $436 million compared to the prior-year period. The decline primarily reflects $94 million of cash restructuring charges and $44 million of transaction related costs, partially offset by operational improvement.
Free cash flow decreased 28% to $354 million for the first six months of 2017 compared to the prior-year period, reflecting a decline in cash flow from operations and a $14 million increase in capital expenditures.
Share Repurchase and Dividend Update
Weighted average diluted shares outstanding decreased 3% year over year to 262.4 million in the second quarter.
The company repurchased 8 million Class A Ordinary shares for approximately $1 billion in the quarter.
As of Jun 30, 2017, the company had $6.7 billion of remaining authorization under its share repurchase program.
In Apr 2017, the company announced a 9% increase in its quarterly cash dividend.
Business Update
Aon completed the sale of the Benefits Administration and HR BPO platform for $4.3 billion of cash consideration. The deal was subject to customary adjustments and additional consideration of up to $500 million.
Zacks Rank and Performance of Other Insurers
Aon presently carries a Zacks Rank #3 (Hold). You can see the complete list of today’s Zacks #1 Rank (Strong Buy) stocks here.
Among other players from the insurance space that have reported their second-quarter earnings so far, the bottom line at The Progressive Corporation (NYSE:PGR) and The Travelers Companies, Inc. (NYSE:TRV) missed their respective Zacks Consensus Estimate, while RLI Corp. (NYSE:RLI) beat the same.
Today's Stocks from Zacks' Hottest Strategies
It's hard to believe, even for us at Zacks. But while the market gained +18.8% from 2016 - Q1 2017, our top stock-picking screens have returned +157.0%, +128.0%, +97.8%, +94.7%, and +90.2% respectively.
And this outperformance has not just been a recent phenomenon. Over the years it has been remarkably consistent. From 2000 - Q1 2017, the composite yearly average gain for these strategies has beaten the market more than 11X over. Maybe even more remarkable is the fact that we're willing to share their latest stocks with you without cost or obligation. See Them Free>>
Aon PLC (AON): Free Stock Analysis Report
RLI Corp. (RLI): Free Stock Analysis Report
The Travelers Companies, Inc. (TRV): Free Stock Analysis Report
Progressive Corporation (The) (PGR): Free Stock Analysis Report
Original post