
Have you been eager to see how Anthem Inc. (NYSE:ANTM) performed in Q4 in comparison with the market expectations? Let’s quickly scan through the key facts from this, Indianapolis, IN based health care company’s earnings release this morning:
An Earnings Beat
Anthem came out with earnings of $2.44 per share, which surpassed the Zacks Consensus Estimate by 10.9%. The same was up 89.1% year over year.
Better-than-expected results were driven by solid operating performance and enhanced performance in all the core businesses.
Anthem came out with earnings of $2.44 per share, which surpassed the Zacks Consensus Estimate by 10.9%. This was up 89.1% year over year.
Better-than-expected results were driven by solid operating performance and enhanced performance in all the core businesses.
How Was the Estimate Revision Trend?
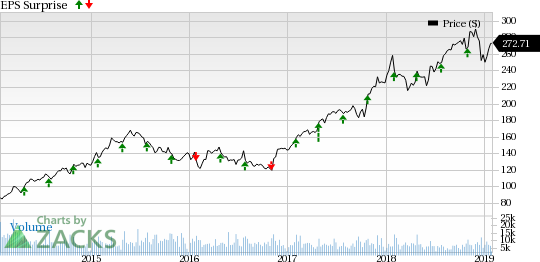
You should note that the earnings estimate for Anthem depicted neutral stance prior to the earnings release. The Zacks Consensus Estimate remained stable over the last seven days.
Nonetheless, Anthem has an impressive earnings surprise history. Before posting the earnings beat in Q4, the company delivered positive surprises in all four trailing quarters.
Overall, the company has a positive earnings surprise of 5.11% in the trailing four quarters.
Revenues In-Line with Estimates
Anthem posted revenues of $22.71 billion, almost in line with the Zacks Consensus Estimate. The same was up 4% year over year.
Key Q4 Statistics
- The benefit expense ratio was 86.8%, up 180 basis points from the prior-year quarter
- Anthem spent $493 million in share buybacks
- Cash flow from operations were $463 million during the fourth quarter of 2018
2019 Outlook
Adjusted net income of the company is expected to be higher than $19 per share in 2019. Investment income is expected to be around $1 billion. Operating revenues is projected to be around $100 billion, including premium revenue of $90.5 billion - $92.5 billion.
Zacks' Top 10 Stocks for 2019
In addition to the stocks discussed above, wouldn't you like to know about our 10 finest buy-and-holds for the year?
From more than 4,000 companies covered by the Zacks Rank, these 10 were picked by a process that consistently beats the market. Even during 2018 while the market dropped 5.2%, our Top 10s were up well into double-digits. And during bullish 2012 – 2017, they soared far above the market's +126.3%, reaching +181.9%.
This year, the portfolio features a player that thrives on volatility, an AI comer, and a dynamic tech company that helps doctors deliver better patient outcomes at lower costs.
See Stocks Today >>
Anthem, Inc. (ANTM): Get Free Report
Original post
Zacks Investment Research