
Anthem Inc.’s (NYSE:ANTM) fourth-quarter 2017 adjusted net income per share of $1.29 surpassed the Zacks Consensus Estimate of $1.25 by 3.2%. The bottom line, however declined 27% year over year.
For 2017, the company’s adjusted net income came at $12.04 per share, up 9.5% from the last year.
Operating revenues of $22.4 billion surpassed the Zacks Consensus Estimate by 1.3%. The top line also grew 4.5% year over year due to premium rate increases as well as higher enrollment in the Medicaid, Medicare, and Local Group insured and self-funded businesses. The upside was partially offset by the impact of the one-year waiver of the health insurance tax in 2017.
For 2017, operating revenues came at $89 billion, up 5.8% year over year.
Quarterly Operational Update
Medical enrollment increased 0.8% year over year to 40.2 million members. The rise was primarily driven by commercial & specialty business. Enrollment growth in Government business also contributed to the appreciation. This upside was partially offset by a decline in membership in the National Account and Individual businesses.
Total expenses increased nearly 7.1% to $22.6 billion in the reported quarter, mainly due to a 6.3% rise in benefitexpenses and 4% increase in selling, general and administrative(SG&A) expenses, both on a year-over-year basis.
Anthem’s benefit expense ratio of 88.6% deteriorated 140 basis points (bps) from the prior-year quarter. This was largely due to the one-year waiver of the health insurance tax in 2017. However, the deterioration was partially offset by improved medical cost performance in the Individual and Local Group businesses.
SG&A expense ratio of 15.1% improved 10 bps from the year-ago quarter. This was due to one-year waiver of the health insurance tax in 2017 and the impact of fixed cost leverage on operating revenue growth. However, the decline was partially offset by increased spend to support growth initiatives during the quarter.
Segment Update
Commercial & Specialty Business
Operating revenues were $10.1 billion in the fourth quarter, up 4.9% year over year.
Operating gain totaled $71.2 million, down 62.4% year over year due to increased spend to support growth initiatives and the impact of the one-year waiver of the health insurance tax in 2017. The decrease was partially offset by improved medical cost performance in the Local Group and Individual businesses.
Operating margin was 0.7%, down 130 bps year over year.
Government Business
Operating revenues were $12.3 billion in the fourth quarter, up 4% from the prior-year quarter.
Operating gain was $360.8 million, down 31.9% year over year. The downside reflected increased spend to support growth initiatives during the quarter and the impact of the one-year waiver of the health insurance tax in 2017. However, the deterioration was partially offset by improved medical cost performance in the Medicaid business.
Operating margin was 2.9%, declining 160 bps year over year.
Other
Operating revenues were $13.6 million in the fourth quarter, up 84% from the prior-year quarter.
The segment reported an operating loss of $51 million, narrower than an operating loss of $66.1 million in the prior-year quarter. The improvement was primarily driven by lower expenses related to the terminated Cigna (NYSE:CI) acquisition.
Operating margin was 1.7%, down 130 bps year over year.
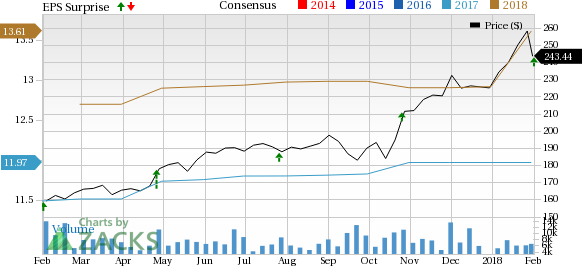
Anthem, Inc. Price, Consensus and EPS Surprise
Financial Update
As of Dec 31, 2017, Anthem had cash and cash equivalents of $3.6 billion, down 11% from year-end 2016.
As of Dec 31, 2017, its long-term debt increased 21% to $17.4 billion from year-end 2016.
As of Dec 31, 2017, shareholder equity was $26.5 billion, up 5.5% from year-end 2016.
Operating cash outflow was $1.3 billion in the fourth quarter. This brings full-year 2017 operating cash flow to $4.2 billion, or 1.1 times net income. This also reflects 28% year-over-year growth over 2016.
During the fourth quarter, Anthem recorded a one-time, non-cash deferred tax benefit from corporate tax reform of $1.1 billion. This reduces total income tax expenses in 2017 to $121 million.
Share Repurchase and Dividend Update
During the quarter, Anthem repurchased 1.8 million shares of its common stock for $362 million.
During 2017, it repurchased 10.5 million shares of its common stock for $2 billion.
As of Dec 31, 2017, it had approximately $7.2 billion of share repurchase authorization remaining.
During the fourth quarter, Anthem paid a quarterly dividend of 70 cents per share.
On Jan 30, 2017, the board declared dividend of 75 cents per share for the first quarter of 2018. This reflects a hike of 7.1%. The dividend will be paid on Mar 23 to shareholders of record on Mar 9.
Guidance for 2018
Anthem expects adjusted net income to be greater than $15.00 per share.
Medical membership is now expected in the range of 40-40.2 million.
Operating revenues are projected in the range of $90.5-$91.5 billion.
Benefit expense ratio is expected to be around 84.5%, with adjustment of 30 bps.
SG&A ratio is expected to be around 15.5%, with adjustment of 30 bps
Anthem expects operating cash flow to be more than $4 billion.
Zacks Rank and Performance of Other Peers
Anthem sports a Zacks Rank #1 (Strong Buy). You can see the complete list of today’s Zacks #1 Rank stocks here.
Among other players in the Medical sector that have reported their fourth-quarter earnings so far, AbbVie Inc. (NYSE:ABBV) , UnitedHealth Group Incorporated (NYSE:UNH) and Abbott Laboratories (NYSE:ABT) have surpassed their respective Zacks Consensus Estimate.
The Hottest Tech Mega-Trend of All
Last year, it generated $8 billion in global revenues. By 2020, it's predicted to blast through the roof to $47 billion. Famed investor Mark Cuban says it will produce "the world's first trillionaires," but that should still leave plenty of money for regular investors who make the right trades early.
See Zacks' 3 Best Stocks to Play This Trend >>
Abbott Laboratories (ABT): Free Stock Analysis Report
AbbVie Inc. (ABBV): Free Stock Analysis Report
UnitedHealth Group Incorporated (UNH): Free Stock Analysis Report
Anthem, Inc. (ANTM): Free Stock Analysis Report
Original post
Zacks Investment Research