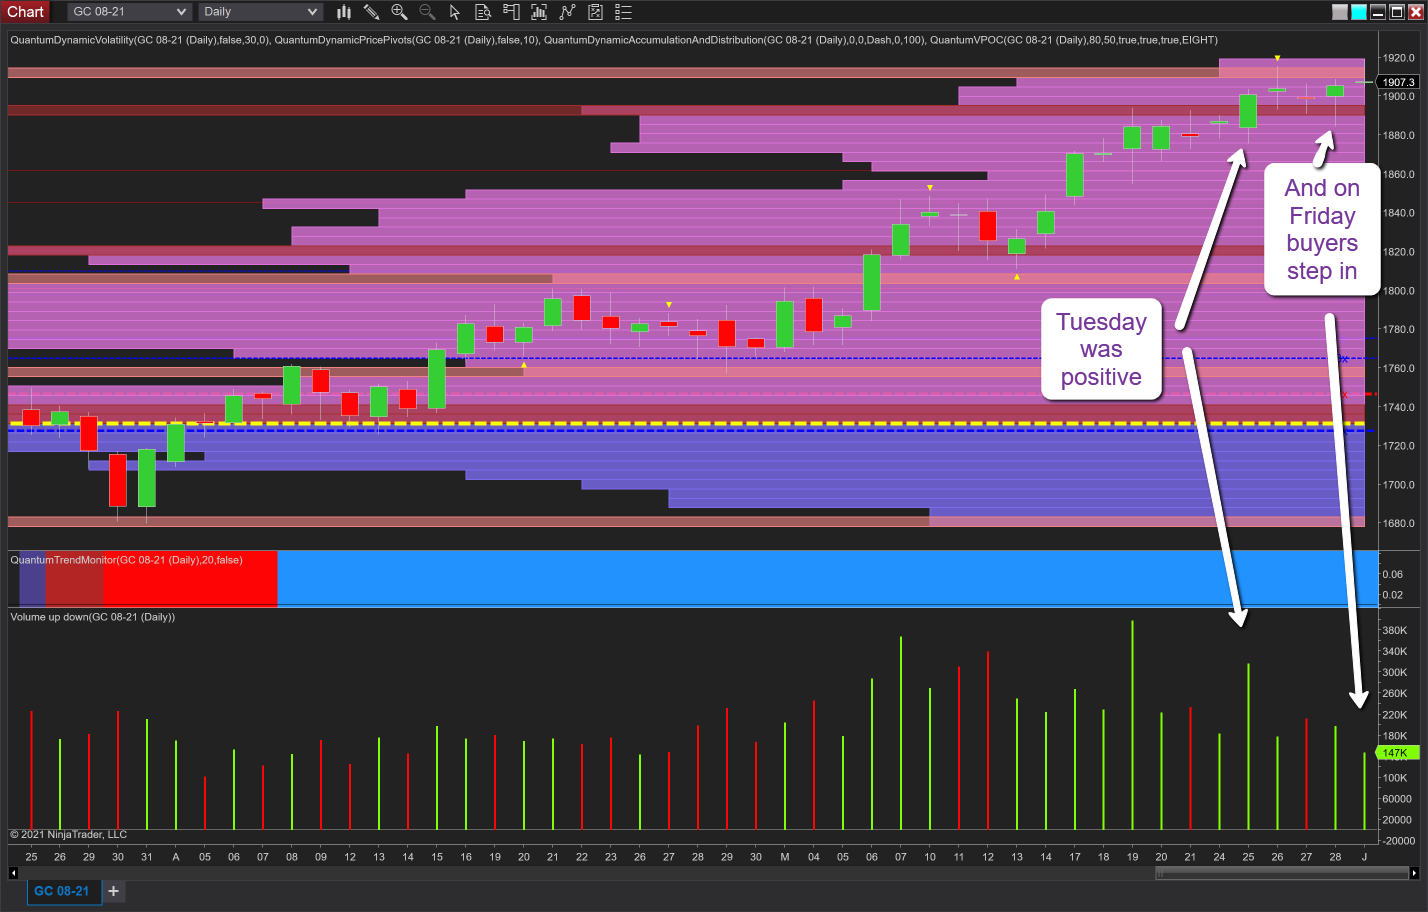
Gold put in another solid performance with the precious metal moving higher and continuing to extend the bullish trend, which saw it climb through the $1,900 per ounce price point as forecast in previous posts with a couple of key days to note last week. The first of these was on Tuesday when, following a quiet start, the price closed up over $17 per ounce on the day ending the session at $1,900.50 per ounce. This was the first touch of this psychological level. Wednesday and Thursday saw some consolidation and indecision at this level, before the second important day’s trading arrived on Friday with the move lower, which was firmly rejected with the buyers stepping in again returning the price above the $1,900 per ounce level on good volume. The shortened trading week has opened with a gap up as bullish sentiment continues to remain strong.

So where next for gold?
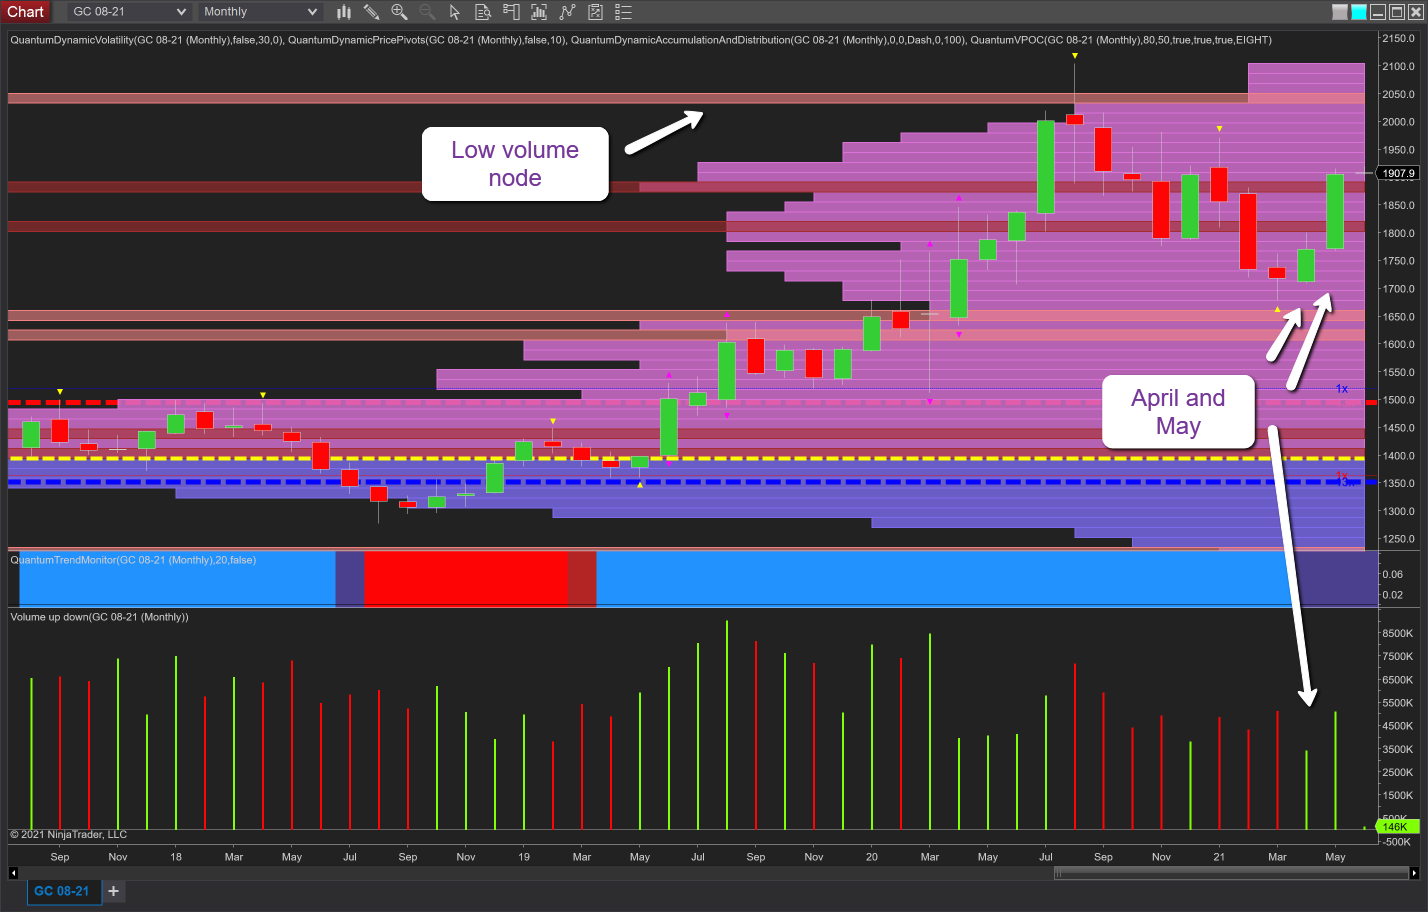
To answer that question we need to turn to the monthly chart. April and May closed on a rising price and associated with rising volume, a positive sign. The key levels are now dictated more by the VPOC histogram rather than price-based resistance. As we can see, the volume falls away as we move towards $1,950 per ounce and beyond and at $2,050, where we have a low-volume node.
As always, the effort required to move higher correlates positively with the depth of volume-based resistance on the histogram to the right of the chart. So as volume falls here, so too does the volume (effort) required to drive the price higher. The key fundamental driver, of course, is inflation. And with a variety of signals suggesting this is rising, the outlook for gold remains bullish, with the potential to move beyond $2,100.
But let’s not get carried away! First, we need to test and break through the $1,950-per-ounce area and, thereafter ,we have the psychological $2,000 level as well as the volume resistance at $2,050. So there are some interesting times ahead for the precious metal.
