In keeping with the ongoing dialogue about the ever-tiring and ever-present sideways trend, it appears that the equity markets are about to neutralize the not-a-disaster jobs report “rally” over the next few days and this is fitting for what is literally called a neutral trend. Pointing to this equal and opposite move down are new Bear Wedges and downside gaps that will fill sooner rather than later even though there is room for a very small move to the upside yet.
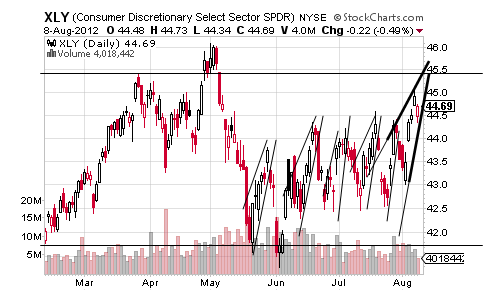
Looking first at the consumer discretionary sector ETF, its latest Bear Wedge was born of a gap at $43.69 and it looks complete in present form with a nice Spike Top apex, but there is the solid possibility that it climbs a bit more to fill an upside gap at $45.50 in a move that would fill out the Sideways Trend Channel too.

The difference between a fulfillment this week and one later next week or the week after comes down to whether the XLY trades with the smaller Bear Wedge in darker trendlines with a target of $43.00 for a potential decline of 4% or whether it combines this smaller Bear Wedge with the last nearly fulfilled pattern that carries a target of $42.54 and nearly a possible drop of 5%.
Either way, though, this drop will occur with a gap closer to the bottom of the sideways trend at $42.00 strongly suggesting it along with the success of the previous five Bear Wedges with it seeming less likely that the XLY will evade that pattern repetition.
Equally important is the fact that this directionless move set-up is present in the XLB, XLE, XLF, XLI and XLK with the last sector ETF making the strong case for at least a 5% move down in these sector ETFs whether it follows a small peak up higher or begins to manifest this week.
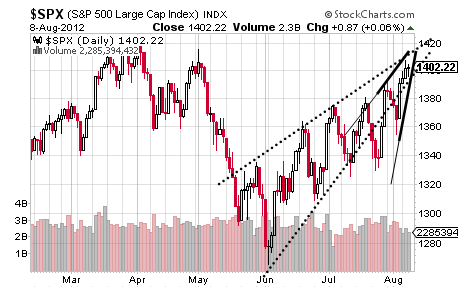
Turning to the equity indices, the Dow Jones Industrial Average and the S&P are not showing the gaps to be filled but are showing new Bear Wedges that rest on the last half-fulfilled patterns for targets of 12522 and 1329, respectively, with the Dow looking ready to peak out higher while the S&P looks ready to drop now with the difference exemplifying the tricky and vicious vagaries of sideways.
What makes this pattern interesting in the S&P is the fact that its potential fulfillment would confirm its larger two-month Rising Wedge that carries a target of 1267 and a pattern that will work and probably in Q3 too.

It is that pattern, of course, that will make for a truly equal and opposite move down for a fourth sideways swipe this year in the current range of 1267 to 1422 and one that will bring out the crash calls from all corners again even though it would be nothing but a 10% decline within the sideways trend just as the move off of the June lows is most likely to amount to a little more than a 10% move up in the sideways trend.
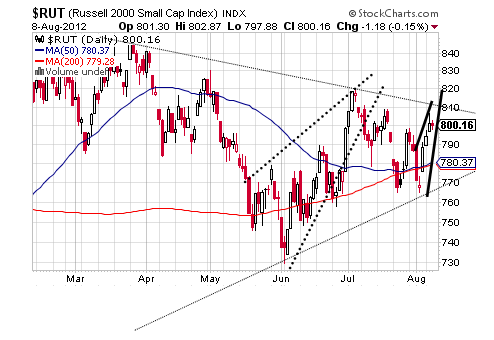
Lastly, let’s look at the Russell 2000 and this small cap index shares a similarity with the Nasdaq Composite in the same downside gap detailed in the XLY from last week while its still-intact trend of near-term lower highs means that its Rising Wedge is actually confirmed and fulfilling still for a target of 730 and perhaps this helps to explain the Russell 2000’s ongoing flirtation with not just its 50 DMA but its 200 DMA as well.

Most important, though, is the convergence of the Russell 2000’s sideways trading into a beautiful Symmetrical Triangle that will carry the index up by 20% or down by 20% for a little repeat of last year into this year with confirmation at 848 or 730 required to have real confidence out of sideways on either side.
Should this breakout follow the Dow and the S&P, it will be to the upside even if for a false initial reaction and it is a small and confirmed Double Bottom that carries a target of 833 that would pave the way for this possibility.
Should the Russell 2000 follow the Dow Transports, however, with its 50 DMA now below its 200 DMA even though not on a real Death Cross, it seems that the Russell 2000 will at least move back down to the bottom of its coiling Symmetrical Triangle before the big break shall be made and one that appears more prone to the downside based on the one-year trend of lower highs.
Interestingly, the Transports is showing an unconfirmed Double Bottom as well with the last one in July failing utterly to perhaps make for some pattern repetition of its own that might be followed by not only the Russell 2000 but the other equity indices as well.
It is this possibility that seems most likely considering that the Bear Wedges and gaps in the sector ETFs and equity ETFs signal another sideways swipe is to strike soon.
Looking first at the consumer discretionary sector ETF, its latest Bear Wedge was born of a gap at $43.69 and it looks complete in present form with a nice Spike Top apex, but there is the solid possibility that it climbs a bit more to fill an upside gap at $45.50 in a move that would fill out the Sideways Trend Channel too.

The difference between a fulfillment this week and one later next week or the week after comes down to whether the XLY trades with the smaller Bear Wedge in darker trendlines with a target of $43.00 for a potential decline of 4% or whether it combines this smaller Bear Wedge with the last nearly fulfilled pattern that carries a target of $42.54 and nearly a possible drop of 5%.
Either way, though, this drop will occur with a gap closer to the bottom of the sideways trend at $42.00 strongly suggesting it along with the success of the previous five Bear Wedges with it seeming less likely that the XLY will evade that pattern repetition.
Equally important is the fact that this directionless move set-up is present in the XLB, XLE, XLF, XLI and XLK with the last sector ETF making the strong case for at least a 5% move down in these sector ETFs whether it follows a small peak up higher or begins to manifest this week.
Turning to the equity indices, the Dow Jones Industrial Average and the S&P are not showing the gaps to be filled but are showing new Bear Wedges that rest on the last half-fulfilled patterns for targets of 12522 and 1329, respectively, with the Dow looking ready to peak out higher while the S&P looks ready to drop now with the difference exemplifying the tricky and vicious vagaries of sideways.
What makes this pattern interesting in the S&P is the fact that its potential fulfillment would confirm its larger two-month Rising Wedge that carries a target of 1267 and a pattern that will work and probably in Q3 too.

It is that pattern, of course, that will make for a truly equal and opposite move down for a fourth sideways swipe this year in the current range of 1267 to 1422 and one that will bring out the crash calls from all corners again even though it would be nothing but a 10% decline within the sideways trend just as the move off of the June lows is most likely to amount to a little more than a 10% move up in the sideways trend.
Lastly, let’s look at the Russell 2000 and this small cap index shares a similarity with the Nasdaq Composite in the same downside gap detailed in the XLY from last week while its still-intact trend of near-term lower highs means that its Rising Wedge is actually confirmed and fulfilling still for a target of 730 and perhaps this helps to explain the Russell 2000’s ongoing flirtation with not just its 50 DMA but its 200 DMA as well.

Most important, though, is the convergence of the Russell 2000’s sideways trading into a beautiful Symmetrical Triangle that will carry the index up by 20% or down by 20% for a little repeat of last year into this year with confirmation at 848 or 730 required to have real confidence out of sideways on either side.
Should this breakout follow the Dow and the S&P, it will be to the upside even if for a false initial reaction and it is a small and confirmed Double Bottom that carries a target of 833 that would pave the way for this possibility.
Should the Russell 2000 follow the Dow Transports, however, with its 50 DMA now below its 200 DMA even though not on a real Death Cross, it seems that the Russell 2000 will at least move back down to the bottom of its coiling Symmetrical Triangle before the big break shall be made and one that appears more prone to the downside based on the one-year trend of lower highs.
Interestingly, the Transports is showing an unconfirmed Double Bottom as well with the last one in July failing utterly to perhaps make for some pattern repetition of its own that might be followed by not only the Russell 2000 but the other equity indices as well.
It is this possibility that seems most likely considering that the Bear Wedges and gaps in the sector ETFs and equity ETFs signal another sideways swipe is to strike soon.
