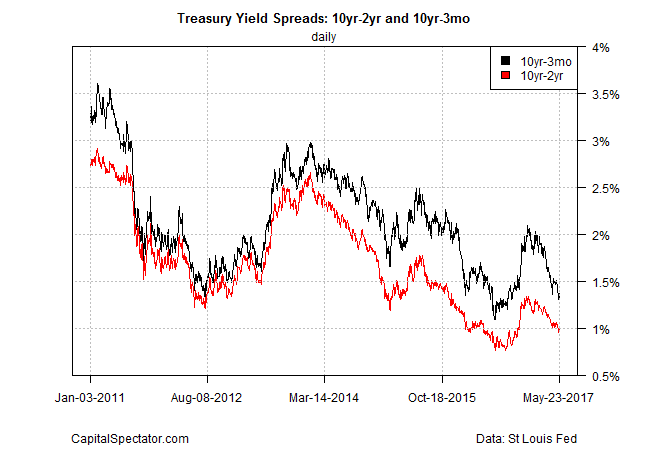
The Federal Reserve is widely expected to raise interest rates again in June, a policy decision that looks set to further squeeze the Treasury yield curve. The spread between the 10-Year and 3-Month yield is already the smallest since last October and another rate hike could cut the difference even more.
Analyzing the implications of a flatter curve has been topical lately, although there’s no sign of a consensus at the moment. CNBC offers a sample of the debate:
As Peter Boockvar of The Lindsey Group sees it, the spread is telling a story about both what traders think the Federal Reserve will do, and how they think the economy is likely to respond to those actions. As he alludes to, short-term bonds tend to be guided closely by expectations of Fed policy, while longer-term yields more purely reflect economic expectations.
When it comes to the falling spread, “It’s becoming clear the reasoning and that is a Fed that is intent on raising short rates due to their statistical employment and inflation hurdles having been met (and thus backward looking viewpoints) and market worries about how the economy will handle that reflected in the drop in long rates,” Boockvar wrote in a Monday note.
Oppenheimer’s Ari Wald, however, doesn’t see trouble on the near-term horizon.
We don’t think the flatter curve is a warning,” he said. “As long as banks can borrow short[-term debt] and lend long[-term debt], we think the economy can do just fine and the stock market can do just fine. In fact, the level and direction of the yield curve now looks a lot like it did in 1994 and it looks a lot like it did in 2004 — years where you still wanted to be invested in stocks.
An inverted curve would be worrisome, signaling elevated risk of recession. But the economic data continue to point to a low probability that a new downturn is near, based on the numbers published to date.
The question is whether the yield curve will continue to tighten? The answer will depend on whether the Fed continues to tighten and how the Treasury market reacts on the longer end of the curve.
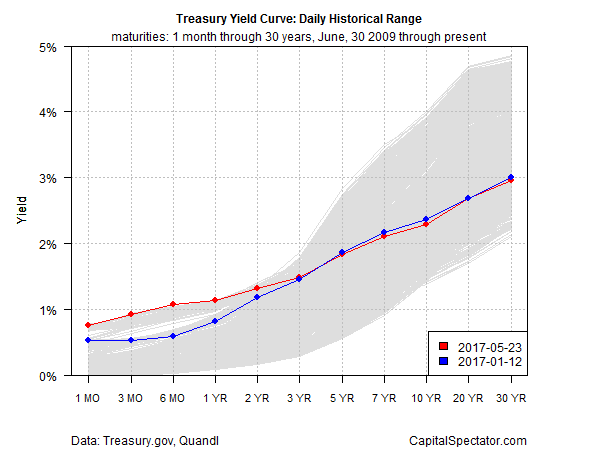
Meantime, it’s clear that a flatter curve is primarily due to the Fed’s recent hikes on the short end. As the chart below shows, yields up to the 2-year maturity are at or close to the highest levels since the recession ended in mid-2009. By contrast, yields from 5- to 30- years are currently in the middle range of rates for the past eight years.

Perhaps the only clear sign at the moment of what a flatter curve implies is the outlook for Fed policy. Jerome Schneider, head of short-term and funding desk at Pimco, told Bloomberg earlier this week that a tighter spread between the 10- and 2-year yield suggests that rates will continue to rise, which in turn could bring more flattening.
Fed funds futures are pricing in an 83% probability of a rate hike for the June 13-14 FOMC meeting, based on CME data in early trading for May 24. The curve, in other words, is expected to flatten a bit more.
Keep in mind, however, that higher short rates could be offset with higher long rates, if bond investors see fit to sell longer-dated Treasuries. In that scenario, any policy squeeze at next month’s FOMC meeting would be offset with higher long yields via lower bond prices. In turn, the yield spread between, say, the 10- and 3-month maturities would remain unchanged. That’s a reasonable assumption… as long as the economic news remains encouraging.
Regardless of what happens next, the yield curve doesn’t look set to invert any time soon. The 10-year/3-month spread, for instance, is still positive to the tune of 137 basis points. But that’s well down from the 200-plus terrain in December (and briefly in January), based on daily data via Treasury.gov.

The margin of safety, in sum, is getting thin. That’s not a risk if the economy is growing. Meantime, the Fed is surely aware that it’s raising rates at a time of a relatively flat yield curve with minimal room before the curve inverts.
None of this appears worrisome for now, given the low recession risk of late. But it’s also true that peaks in the economic cycle are only obvious after the fact. By definition, those peaks arrive when current conditions are healthy.
That simple fact raises the question of whether the current expansion, the third-longest on record, is destined to endure. Economists at Goldman Sachs (NYSE:GS) are optimistic. “The likelihood that the expansion will break the prior record is consistent with our long-standing view that the combination of a deep recession and an initially slow recovery has set us up for an unusually long cycle,” the investment bank advised in a recent note.
A reasonable guesstimate, based on the numbers in hand today. But after eight years of expansion, and a yield spread that’s becoming unusually compressed, careful monitoring of the incoming economic data is increasingly critical.
